|
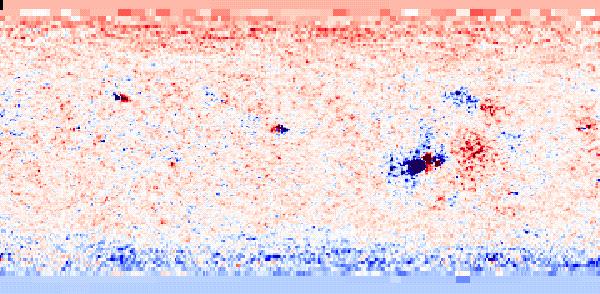
Photospheric magnetic field maps at solar minimum. |
CR1912 (July 25 - August 22, 1996)

CR1913 (August 22 - September 18, 1996)

Photospheric magnetic field maps for Carrington rotations
CR1912 and CR1913 (August-September, 1996),
as measured by the
National Solar Observatory at Kitt Peak. The maps show the measured
photospheric field as a function of latitude (vertical axis)
and Carrington longitude (horizontal axis). Red shows outward directed
magnetic flux, and blue shows inward directed flux.
Click the images for higher resolution pictures.
This interval was part of a coordinated campaign, known as
Whole Sun Month, and coincided with the minimum of the solar activity cycle.
 Return to the Coronal Modeling Page