(a)
Magnetic field
lines predicted from the MHD model.
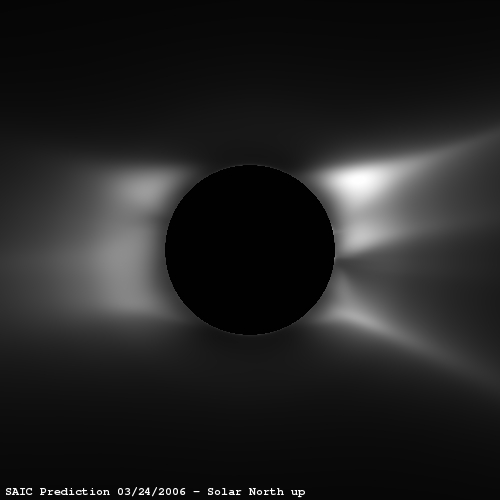
(b) The polarization brightness
predicted from the MHD model.
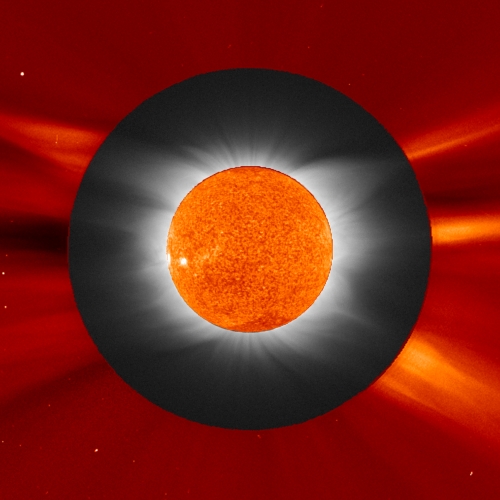
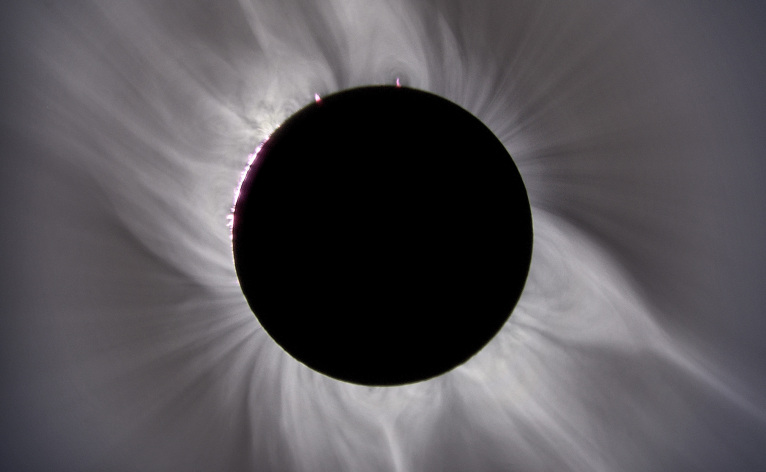
(c)
A
composite of an eclipse image
(gray) taken in Kastellorizo, Greece, by the Williams College Eclipse
Expedition, an image of the Sun’s surface in He II 304Å (inner
orange-colored image), taken with the
EIT instrument, and
an image from the
LASCO C2
coronagraph (outer red-colored image); click
here
for details. The EIT and LASCO instruments are on board the
Solar and Heliospheric
Observatory (SOHO) spacecraft. These images are oriented so
that solar north is
vertically up.
*Photo credit: The eclipse photo was taken by the Williams College
Eclipse
Expedition (Jay Pasachoff, Bryce Babcock, Steven Souza, Jesse Levitt,
Megan Bruck, Shelby Kimmel, Paul Hess, Anna Tsykalova, and Amy Steele),
with support from NSF/NASA/National Geographic.
(a)
Magnetic field
lines predicted from the MHD model.
(b) The polarization brightness
predicted from the MHD model.
(c)
An eclipse
image taken in Sidi Barany, Egypt, by the team from
Institut D'Astrophysique de Paris,
France. For details about the expedition, please click
here.
These images are oriented with solar north 52 degrees clockwise from
vertical.
**Photo credit: Courtesy of Jean Mouette and Serge Koutchmy, CNRS
(France).
Comparison
Between
the 3D MHD Model Prediction
and a Solar Eclipse Observation from Egypt
|
(a) MHD Model: Predicted
Magnetic Field Lines
|
(b) MHD Model: Predicted
Polarization Brightness
|
(c) Image from Egypt:
Christian Viladrich***
|

|

|

|
Click on the images to see higher resolution
versions
(a)
Magnetic field
lines predicted from the MHD model.
(b) The polarization brightness
predicted from the MHD model.
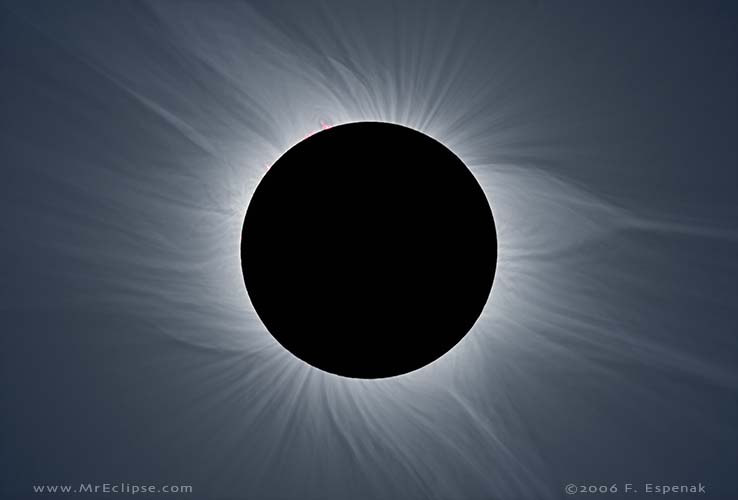
(c)
An eclipse
image taken in As Sallum, Egypt, by
Christian
Viladrich. These images are oriented so that terrestrial
north is vertically up (i.e., solar north is 26 degrees clockwise from
vertical).
***Photo credit: Institut d'Astrophysique de Paris – CNRS & UPMC –
Observation and processing by Ch. Viladrich.
Comparison
Between
the 3D MHD Model Prediction
and a Solar Eclipse Observation from Libya
|
(a) MHD Model: Predicted
Magnetic Field Lines
|
(b) MHD Model: Predicted
Polarization Brightness
|
(c) Image from Libya:
Fred Espenak**** |

|

|

|
Click on the images to see higher resolution
versions
(a)
Magnetic field
lines predicted from the MHD model.
(b) The polarization brightness
predicted from the MHD model.
(c)
An eclipse
image taken in Jalu, Libya, by
Fred
Espenak. A composite image from 22 separate exposures was
produced using Adobe Photoshop CS2. This version has been
enhanced to reveal subtle coronal structures using a narrow radial
filter. According to Fred Espenak, this image closely
approximates the visual appearance of the corona during totality.
These images are oriented so that terrestrial
north is vertically up (i.e., solar north is 26 degrees clockwise from
vertical).
****Photo credit: ©2006 by
Fred
Espenak using Nikon D200 and Vixen 90mm f/9 Fluorite Refractor, 1
to 1/1000 second.
Comparison
Between
the 3D MHD Model Prediction
and GOES/SXI X-Ray Emission
|
(a) MHD Model: X-Ray Emission
on 03/03/2006 at 19:01UT
|
(b) MHD Model: X-Ray
Emission
on 03/13/2006 at 00:29UT
|
(c) MHD Model: X-Ray Emission
on 03/29/2006 at 12:57UT |
|
|
|
|
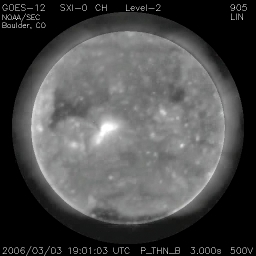
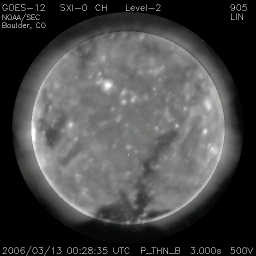
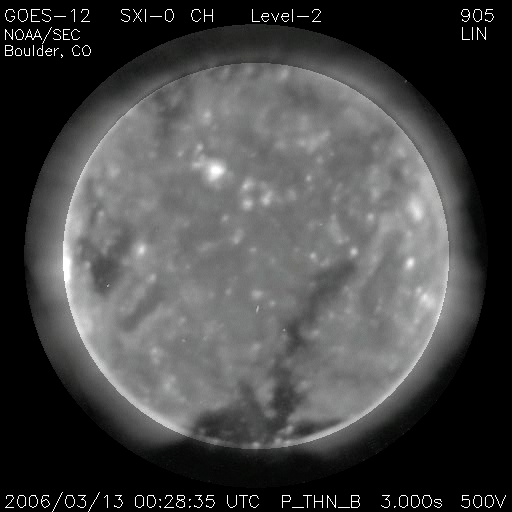
(d) GOES/SXI Emission
on 03/03/2006 at 19:01UT
|
(e) GOES/SXI Emission
on 03/13/2006 at 00:29UT
|
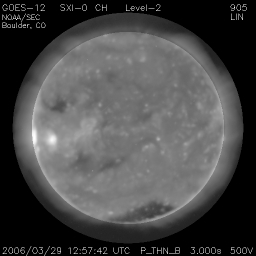
(f) GOES/SXI Emission
on 03/29/2006 at 12:57UT
|
 |
|
|
Click on the images to see higher resolution
versions
Comparison of emitted X-ray radiation from the MHD model and the
Solar X-ray Imager (SXI)
on the GOES satellite.
(a–c)
The upper images (colored red) show the
emission computed from the coronal plasma temperature and density
estimated from the MHD model. A movie of the emission from the
MHD model can be found
here.
(d–f) The lower images (gray
scale) show X-ray emission measured by SXI.
The exact nature of the
heating in the solar corona is not know—it is presently a major
unsolved solar physics problem. We assumed an empirical heating
in the MHD model that is related to the strength of the magnetic
field. Images of X-ray emission depend sensitively on the
response of
the measuring instrument. Here we used the response of the
Yohkoh X-ray imager,
which is no longer operational, since we have not yet implemented the
characteristics of the SXI imager. Therefore, we cannot expect to
match the SXI emission in detail. Note that dark regions in these
images correspond to areas with cool
temperatures and lower density, and are known as "coronal holes".
Typically coronal holes are sources of fast solar wind.
There is reasonable correspondence between coronal holes in the model
and in the observations. The bright localized features
(seen especially in images
(a)
and
(d)
on March 3) correspond to X-ray emission from the strong magnetic
fields in an
active region. Since we used magnetic field data for this
simulation
that was measured from February 18 to March 17, 2006, we expect the
active-region emission on March 3 ought to agree with observations, as
it does. However, by eclipse day on March 29 it is evident that
the
active region emission does not compare well with observations (compare
images
(c) and
(f)), because the magnetic field on
the Sun had changed significantly in the active regions. Indeed,
an examination of
MDI
magnetograms shows that the active region that is bright in image
(c),
which was observed on the solar disk in early March, had diffused
significantly by late March, and, furthermore, a new active region
complex had emerged and was visible on the solar disk in late March and
early April (and particularly on eclipse day, March 29). This new
active region is on the East (left) solar limb of the SXI X-ray image
(f).
This illustrates the fact that it is particularly difficult to predict
the emergence of active regions on the Sun far in advance. On the
other hand,
new
developments in acoustic imaging of the interior of the Sun offer
exciting future possibilities for active region imaging of the far side
(i.e., the side we don't see) of the Sun.


