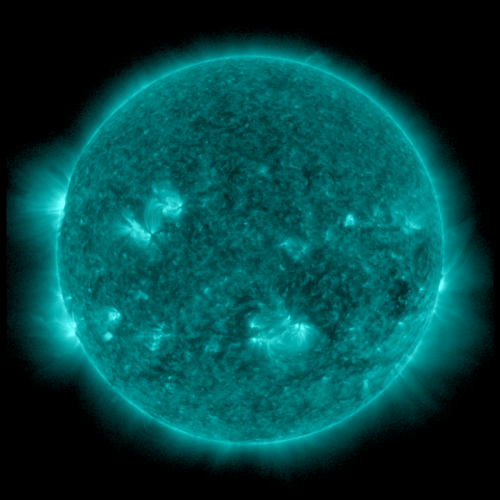
| EUV 94Å
Emission (AIA) November 4, 2012 23:59 UTC Observed |
|---|
 |
| EUV 131Å
Emission (AIA) November 4, 2012 23:59 UTC Observed |
|---|
 |
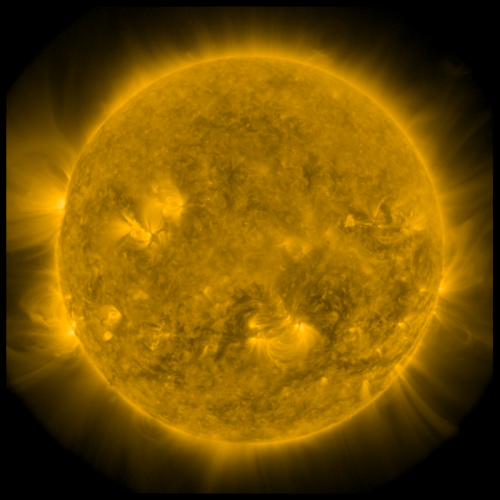
| EUV 171Å
Emission (AIA) November 4, 2012 23:59 UTC Observed |
|---|
 |
| EUV 193Å
Emission (EIT) November 4, 2012 23:59 UTC Observed |
|---|
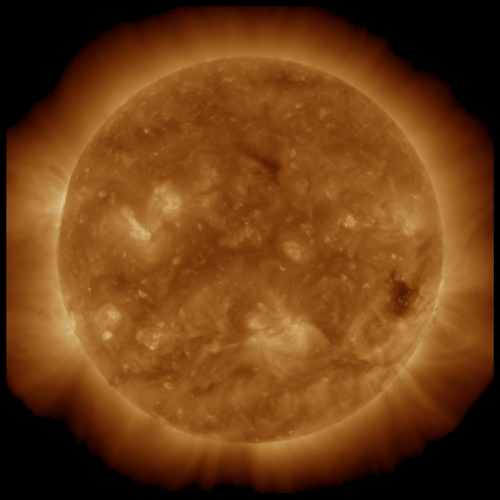 |
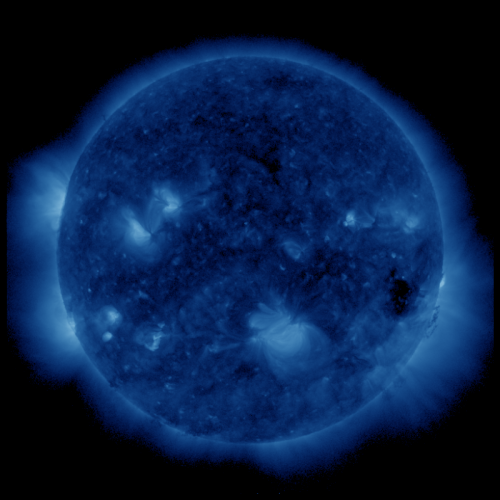
| EUV 211Å
Emission (AIA) November 4, 2012 23:59 UTC Observed |
|---|
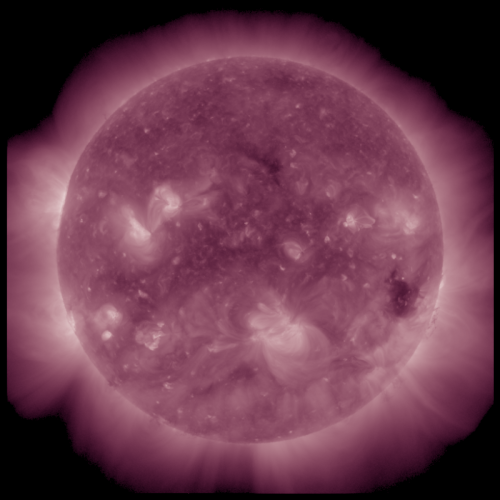 |
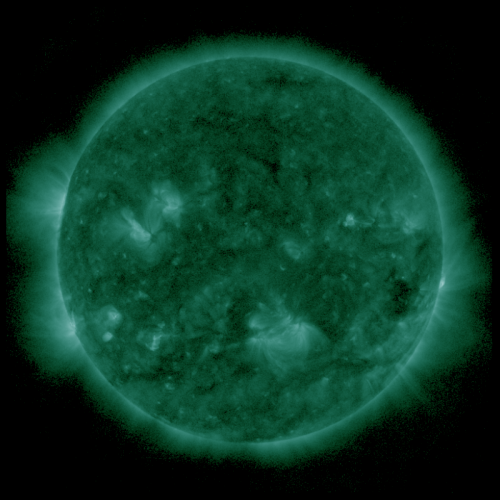
| EUV 335Å
Emission (AIA) November 4, 2012 23:59 UTC Observed |
|---|
 |
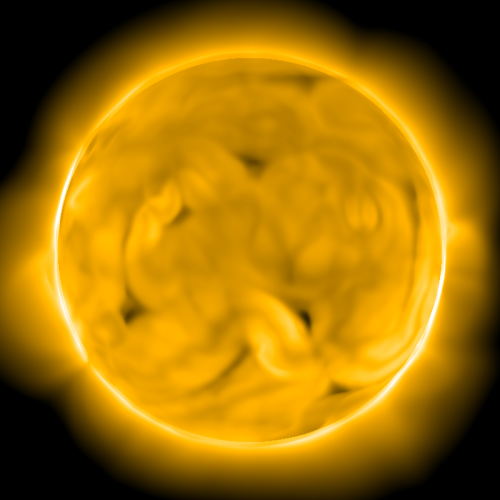
| EUV 94Å
Emission (AIA) November 4, 2012 23:59 UTC Simulated |
|---|
 |
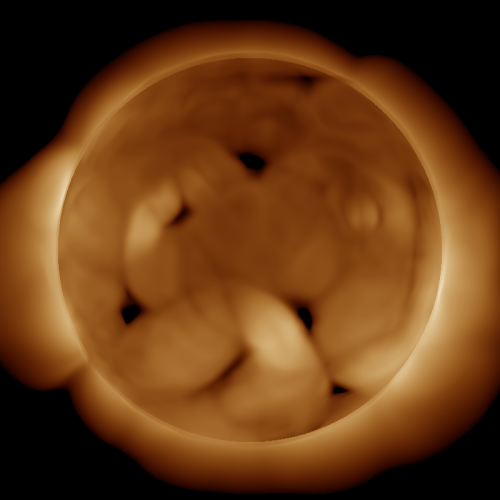
| EUV 131Å
Emission (AIA) November 4, 2012 23:59 UTC Simulated |
|---|
 |
| EUV 171Å
Emission (AIA) November 4, 2012 23:59 UTC Simulated |
|---|
 |
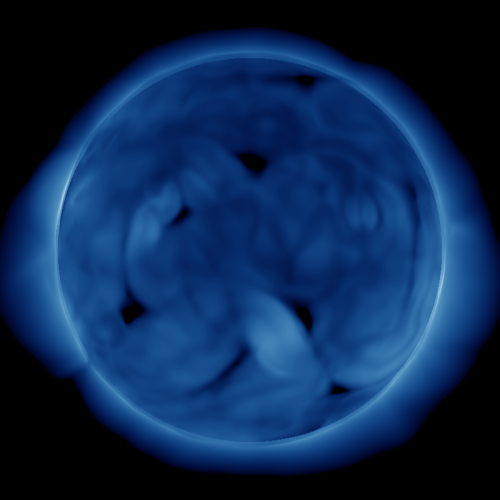
| EUV 193Å
Emission (EIT) November 4, 2012 23:59 UTC Simulated |
|---|
 |
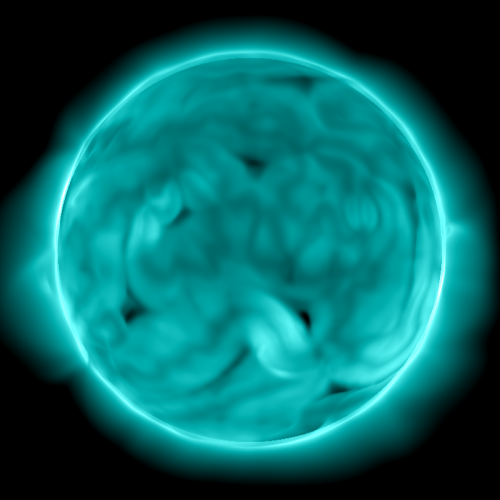
| EUV 211Å
Emission (AIA) November 4, 2012 23:59 UTC Simulated |
|---|
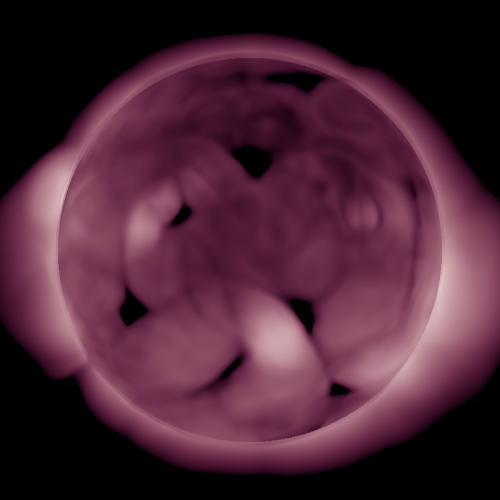 |
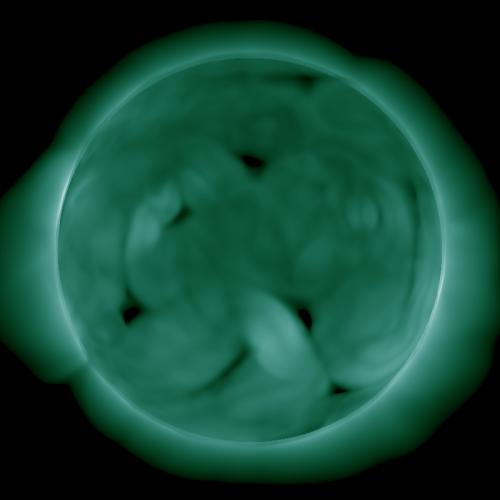
| EUV 335Å
Emission (AIA) November 4, 2012 23:59 UTC Simulated |
|---|
 |