| EUV 94Å
Emission (AIA) Eclipse Time |
|---|
 |
| EUV 131Å
Emission (AIA) Eclipse Time |
|---|
 |
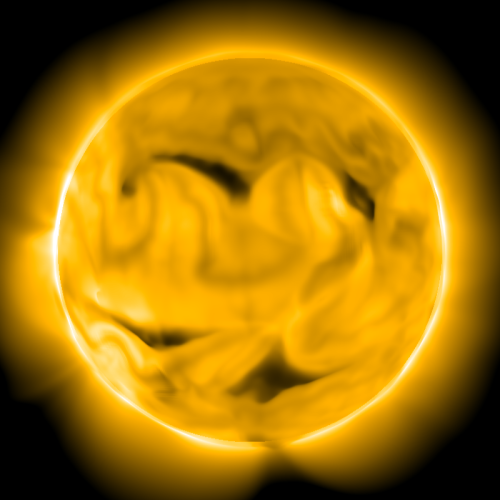
| EUV 171Å
Emission (AIA) Eclipse Time |
|---|
 |
| EUV 193Å
Emission (EIT) Eclipse Time |
|---|
 |
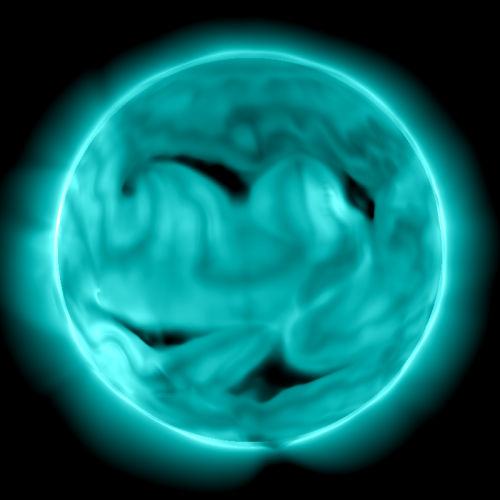
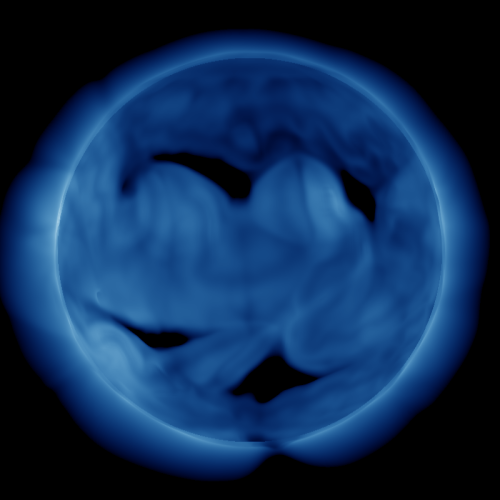
| EUV 211Å
Emission (AIA) Eclipse Time |
|---|
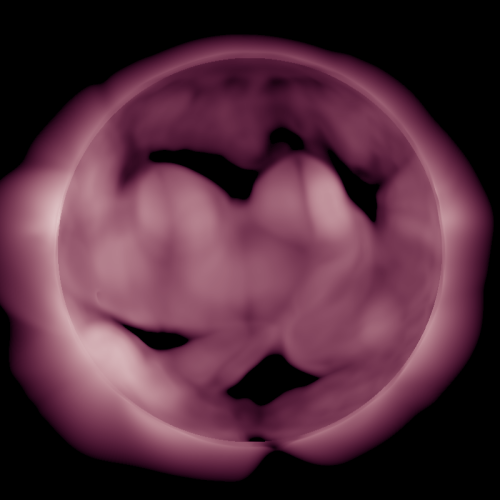 |
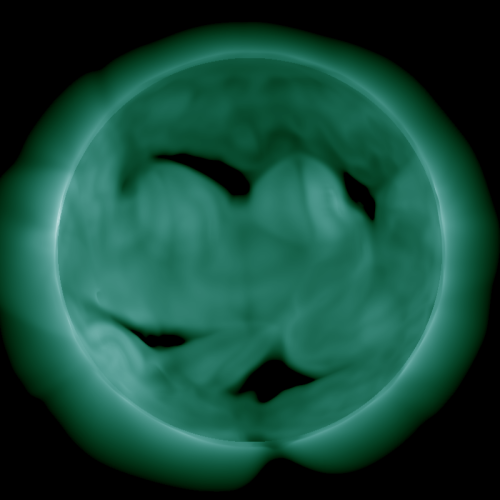
| EUV 335Å
Emission (AIA) Eclipse Time |
|---|
 |
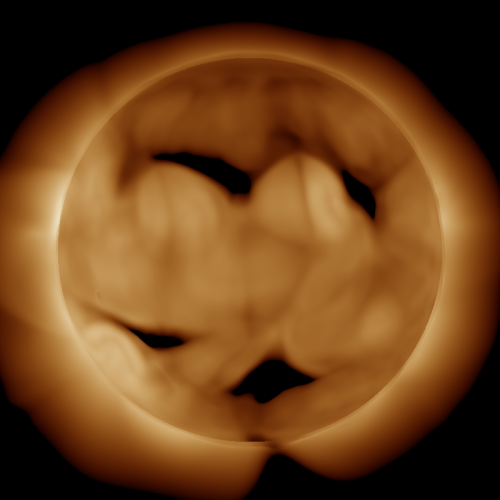
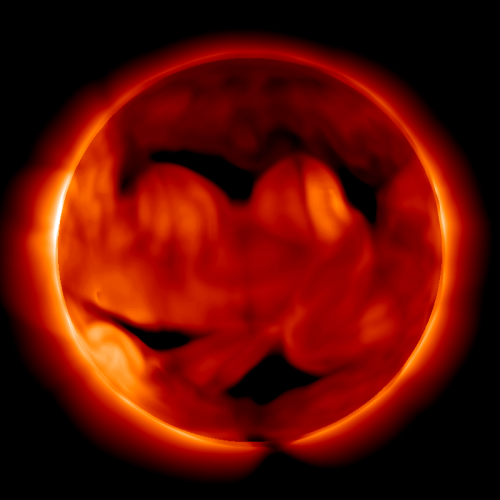
| X-Ray Emission (XRT
Al-mesh) Eclipse Time |
|---|
 |
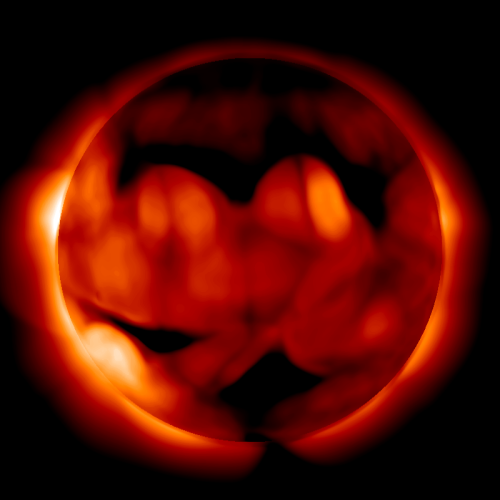
| X-Ray Emission (XRT
Ti-poly) Eclipse Time |
|---|
 |