New changes in left panel need to be 'Run' before Stat Tables will update properly.
The app uses a compartmental SE[I]R model stratified by age and disease severity. The four severity compartments of [I] are asymptomatic, mild, flu-like, and severe. Mild and flu-like infections have COVID-19 symptoms, but do not require hospitalization. As the data progresses, these two severities will have different probabilities of being tested and becoming confirmed cases. Only the severe compartment leads to a need for an ICU bed with the outcome being either reocvery or death.
Country Defaults
When the user selects a country, the app fills in estimates for population, date of first cases, and R0. Approximate number of first cases always defaults to 100.
Country default Basic Reproduction Number (R0): For each country we fit the reported cumulative number of deaths using a two-value model for R(t). The initial and final values of these fits are used as default values for R0 and the reduced transmission R(t).
Approximate Date of First Cases: this date is estimated as follows. For any given country, we find the date of first reported death and assume that on this date there were already 1,000 cumulative cases in this country. Using our estimate for basic reproduction number, we run our model and find how many days it takes to reach a total of 1,000 cases. Using this number of days and the reported date of first death we determine our estimate for the date of first case(s). This process is repeated for each country.
Warning Flags
A few potential data/results issues are automatically flagged. It is difficult to set absolute thresholds to perfectly differentiate between good/bad data/results, so the flags should be treated as cautionary. These flags result in warning banners that appear at the top of the Visualizations tab and are color-coded: yellow-caution, red-alert.
In certain countries, early intervention measures cobmined with extensive testing and isolation have been successful at keeping the confirmed number of cases and/or deaths and/or CFR low. Whereas, the above criteria would automatically flag these countries we do not display alert/warning flags for the following locations: Australia (All, New South Wales, Queensland, Victoria), Baharian, Iceland, Kuwait, New Zealand, Oman, Qatar, Singapore and United Arab Emirates.
Age Parameters
Model parameters are specific to age. The following table shows the severity probabilities for each age group rounded to 2 decimal places.
Each compartment of the model is stratified by age. Civilian distributions have nine age groups (0-9, 10-19,..,80+). The military distribution is broken up into six age groups (0-9 removed and above 60 is combined into 60+). The military age groupings maintain decadal spacing for easy comparison with civilian populations.
Basic Reprodution Number Modulation
The Basic Reproduction Number R0 may be time-dependent R(t) via four options:
1. Use the results of our fit to each country. We use a smoothly varying function for R(t). We fit the initial value of the reproduction number, the day it begins to change, the second value it has, the number of days it remains with this second value, and the third value of R(t). We use the reported cumulative death (bottom plot in main 'Visualization' tab) for the fits. This is done for each country in our list and the values we obtain are used as defaults for options 2, 3 nad 4 below
2. Use the R(t) profile resulting from our fit to an alternate country. This applies the time-dependent reproduction number of the selected alternate country to the population and date-of-first-cases of the original country. This feature provides the user with the flexibility to notionally apply an alternate country's disease profile to a country of interest. However, model results can be highly sensitive to parameter changes. As such, the resulting models should only be disseminated with proper caveats indicating that this is not a prediction.
3. Change is triggered by day number. The user is promted to select the initial reproduction number, the duration of this initial value, the second reproduction number, its' duration, and the third reproduction number. Default values for all five parameters are derived from our fits to the reported cumulative deaths.
4. Change is triggerd when the need for ICUs exceeds a user determined threshold. In this case the reproduction number can only change one time and this change begins when the user speficied threshold is exceeded. Default values for are derived from our fits to the reported cumulative deaths
5. User enters an initial R0 value for the population and date ranges for each intervention type. A distribution describing proportional drop in R as a result of each intervention is derived from Imperial College Coronavirus Report #13. R(t) profiles are generated from date range and a draw from each parameter distribution. Currently, only the mean R(t) profile is used in simulations.
Interval Parameters
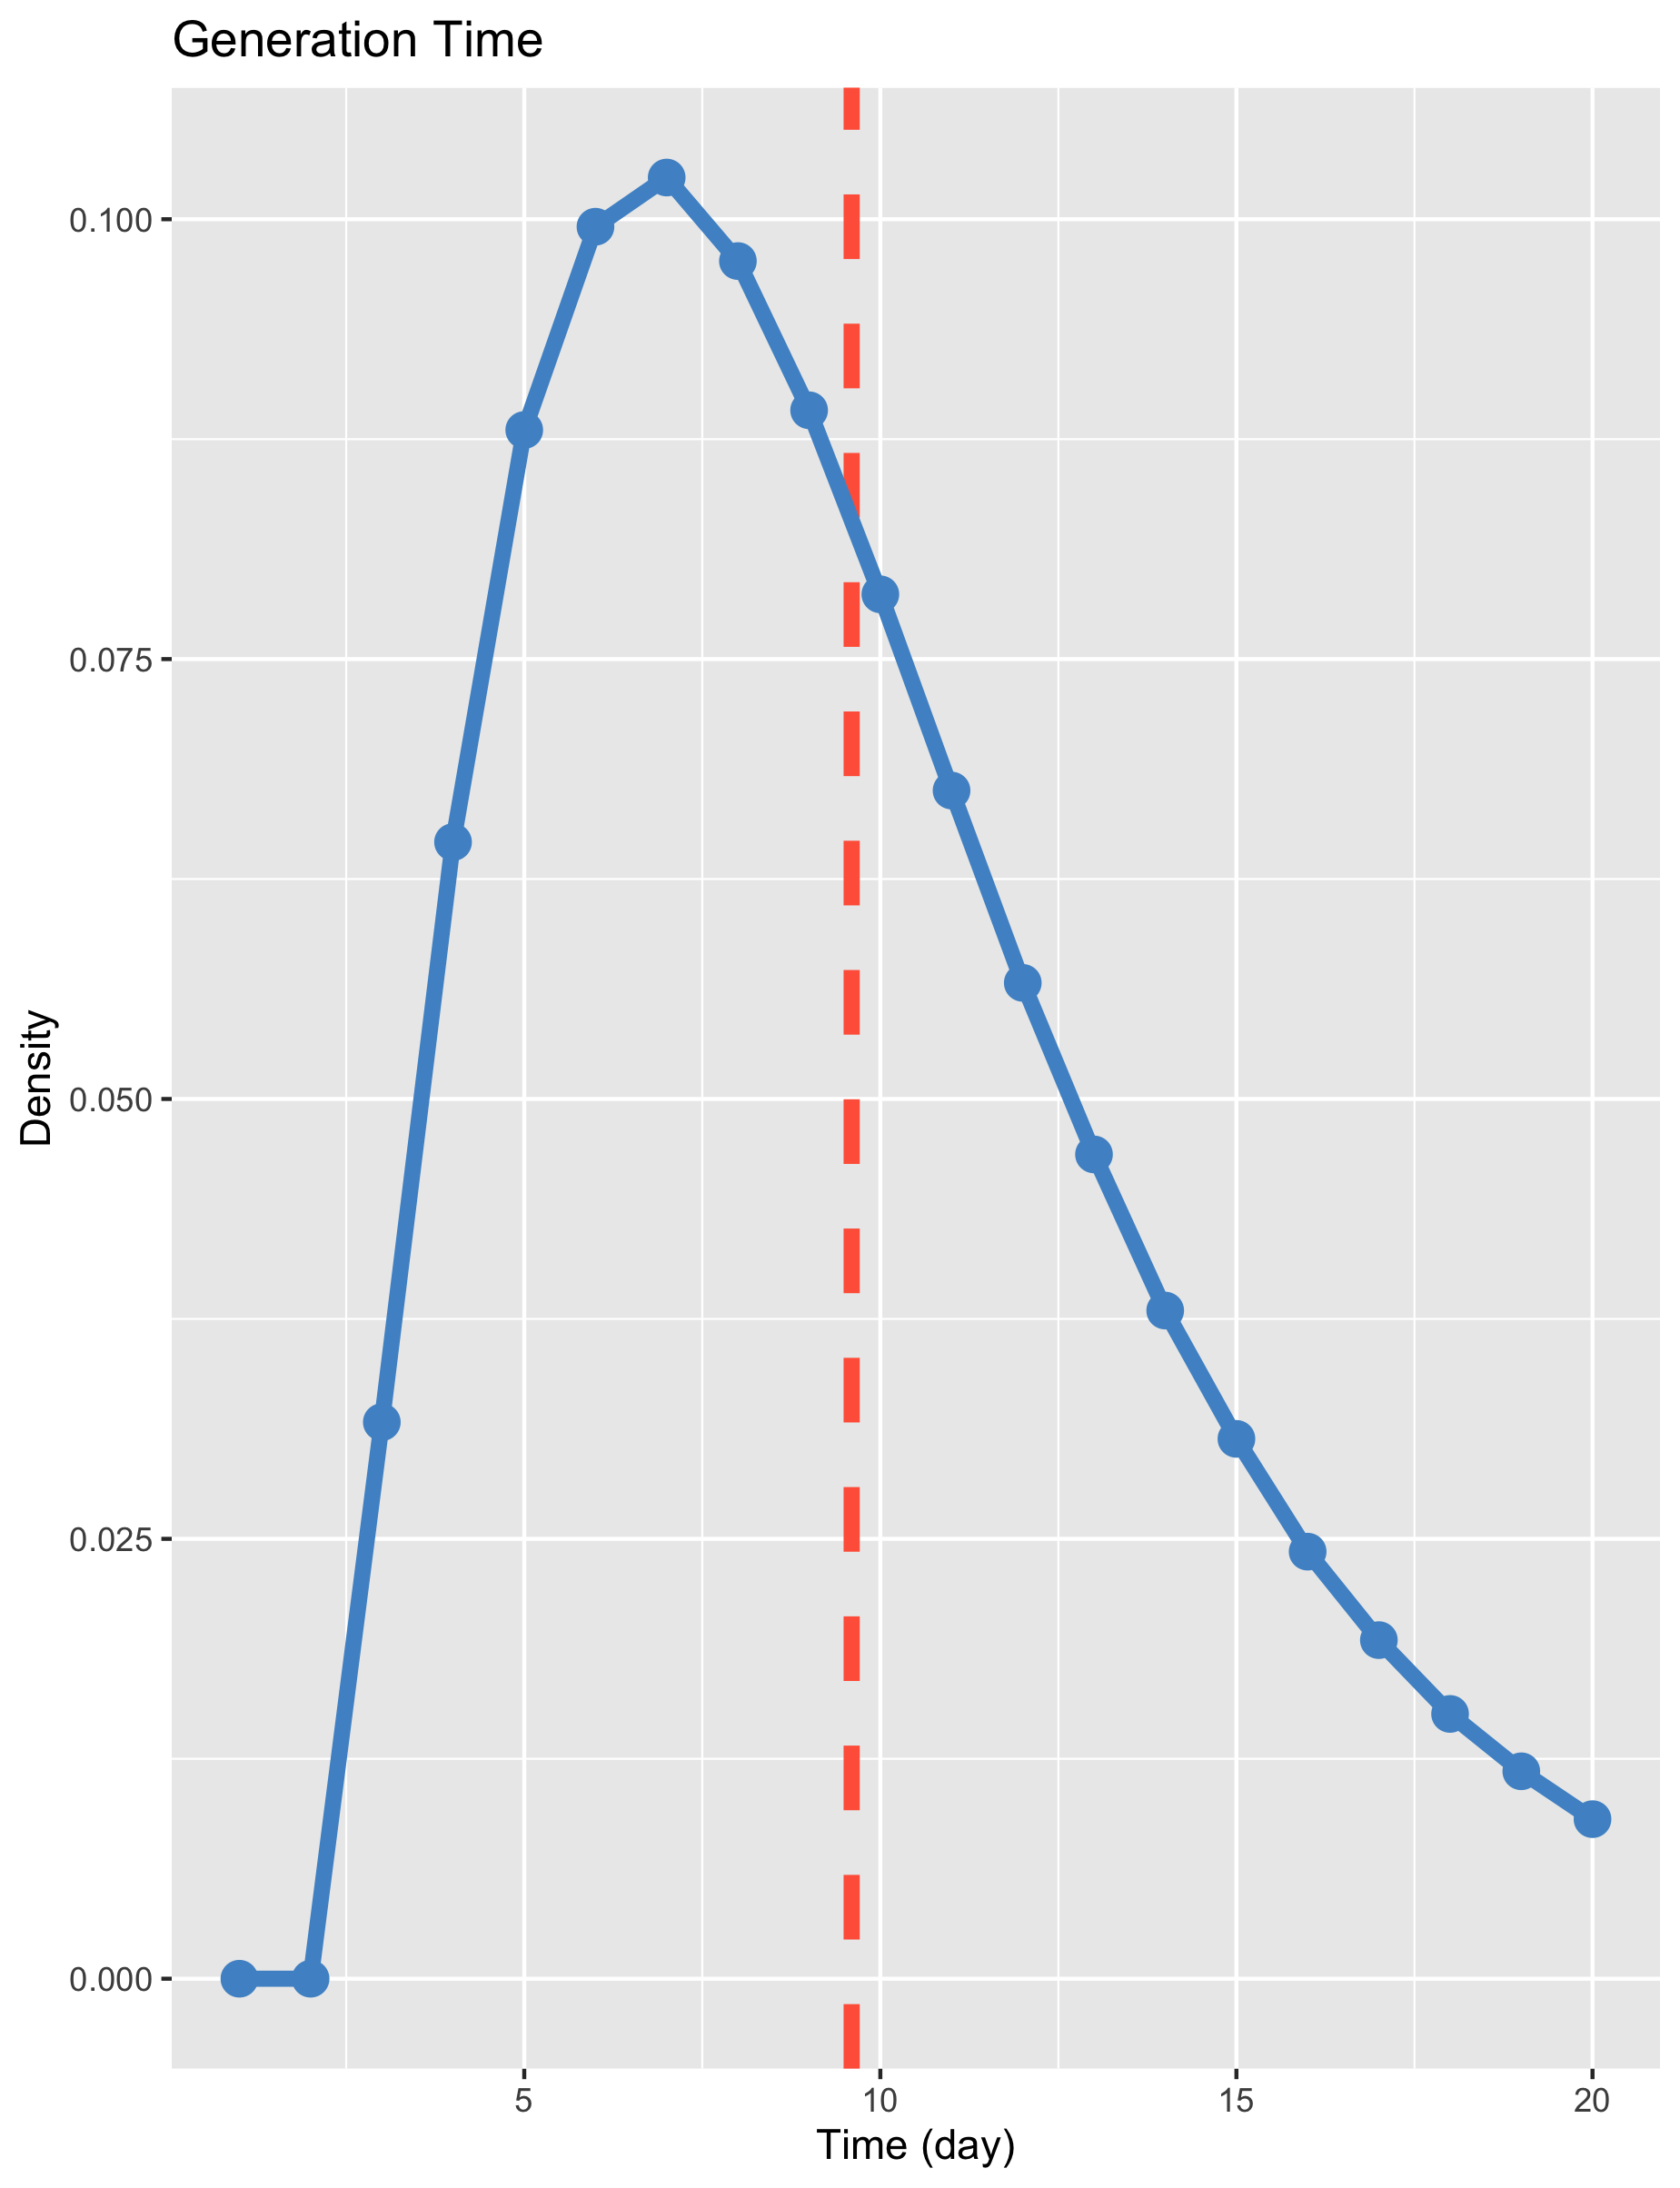
The stochastic nature of these simulations result in the distribution of generation times in the figure below. The mean generation time-or serial interval-is 9.6 days. The majority of transmission occurs 5-10 days after infection.
Individuals leaving the severe state enter ICU. Mean waiting time in the ICU is set to 7 days.
Technology
All the data and model analysis are done with R codes and displayed using R, shinyApp and plotly.
For questions about this web site please contact:
Dr. Pete Riley: pete@predsci.com
Dr. M. Ben-Nun: mbennun@predsci.com
Dr. J. Turtle: jturtle@predsci.com
9990 Mesa Rim Rd, Suite 170
San Diego, CA 92121
Phone: (858) 450-6494