Note
Go to the end to download the full example code.
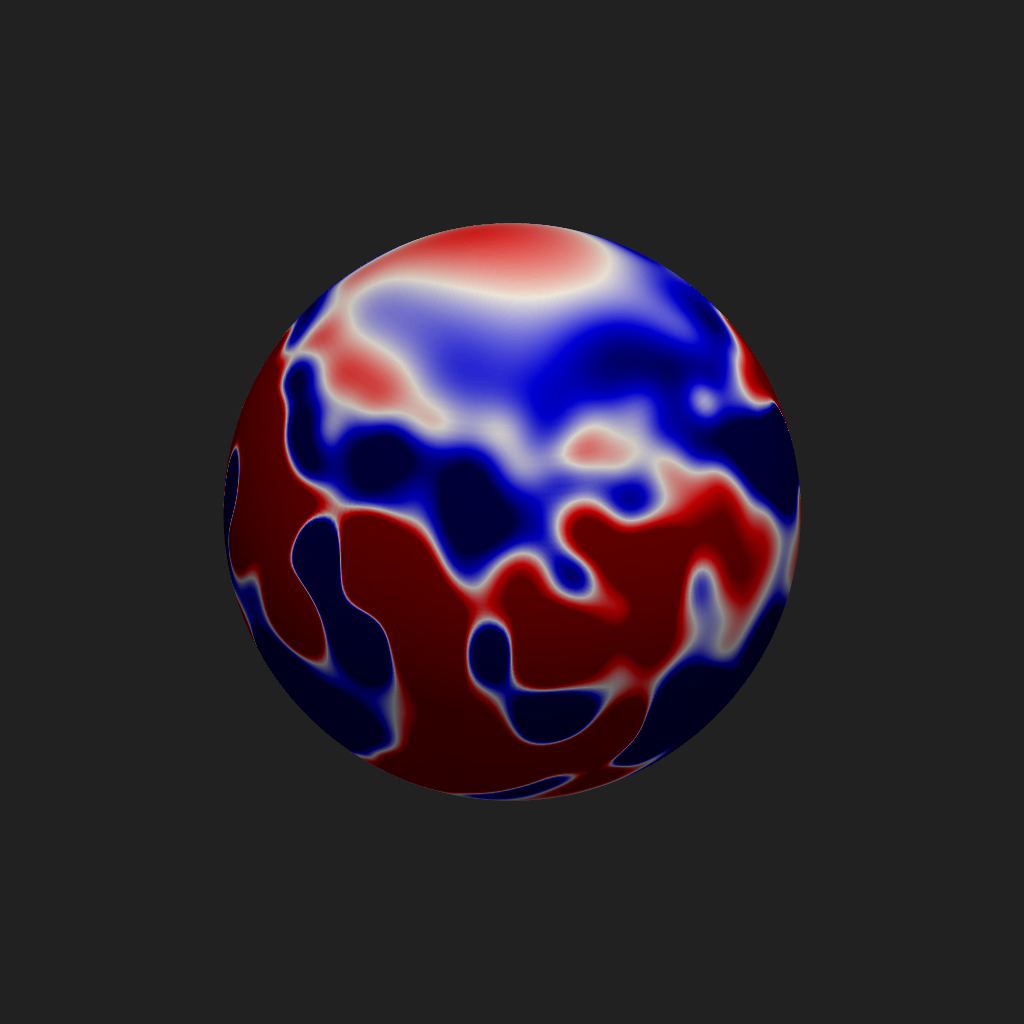
TODO add description
from pyvisual import Plot3d
from pyvisual.utils.data import fetch_datasets
from psi_io import np_interpolate_slice_from_hdf
from mapflpy.tracer import Tracer
import numpy as np
import astropy.units as u

from pyvisual.utils.geometry import cartesian_pointmesh

data = fetch_datasets("cor", ["br", "bt", "bp"])
br, *scales = np_interpolate_slice_from_hdf(data.cor_br, 1, None, None)
br_t, br_p = scales

plotter = Plot3d()
plotter.add_2d_slice(1, br_t, br_p, br,
                     clim=(-1, 1),
                     cmap="seismic",
                     show_scalar_bar=False)
tracer = Tracer(*data)

r = 15
t = np.pi/2
p = np.linspace(0, 2*np.pi, 180)

lps, weights = cartesian_pointmesh(r, t, p, angular_radius=1, dimensionality=(1, 0, 1), pts_per_direction=5)
fieldlines, *_ = tracer.trace_fbwd(launch_points=lps.reshape((3,-1)))
fls = fieldlines.reshape((-1,) + lps.shape)
d=1

# for i in range(180):
#
#     fl = fls[...,i]
#
#     plotter.add_points(*lps[...,i],
#                        name="Launch Points",)
#
#     plotter.add_fieldlines(*np.swapaxes(fl, 0, 1),
#                            weights,
#                            cmap='hsv',
#                            name='Fieldlines',
#                            show_scalar_bar=False,
#                            opacity='linear_r')
#     plotter.show()
plotter.show()
Total running time of the script: (0 minutes 7.071 seconds)