Notes on “The Correction
factor between SOLIS and WSO”
Here is the scatter plot from Leif’s SHINE workshop:
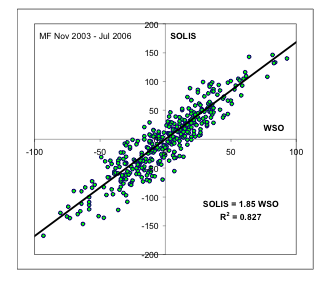
This was, presumably computed from the mean field estimates.
However, here is the scatter plot between Kitt Peak (SOLIS for this example, but the results are the same for 3 other rotations using the old instrument) and WSO.
The first plot was computed by applying the “Wilcox” correction factor to the WSO data (that is x1.85):
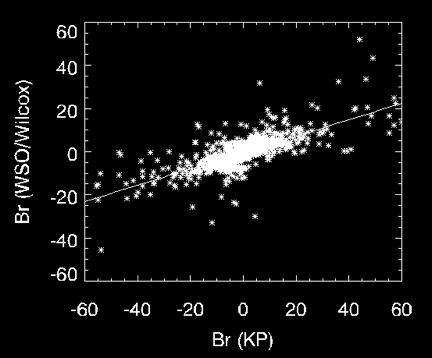
the intercept is -0.374632 and the slope is 0.379543 ( or 1/2.6).
On the other hand, if I use the “MWO” correction factor on the WSO data (4.5 – 2.5sin^2(lat), I get:
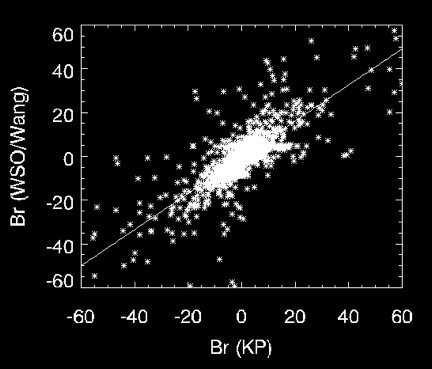
Where the intercept is -0.424503 and the slope is 0.825847 (or 1/1.2).
Why the disconnect? For individual Carrington rotations, the
Wang (or MWO) correction to the WSO data seems to work. Yet, over much longer
periods, the mean field scatter plot suggests the 1.85 correction is correct.