The photospheric magnetic field maps we use for our calculations are built up from daily observations of the Sun during a solar rotation. These maps give a good approximation of the Sun's magnetic flux if the large-scale flux does not change much throughout a rotation.
The following figures show the evolution of the radial component (Br) of the solar photospheric magnetic field for approximately three Carrington rotations preceding the eclipse, as measured by the HMI magnetograph aboard NASA's SDO spacecraft. These maps show the radial component of the magnetic field (Br) deduced from the measured line-of-sight component of the photospheric field as a function of latitude and Carrington longitude. Red shows magnetic field directed out of the Sun; blue shows magnetic field directed into the Sun. The black regions show areas where the solar poles were either not visible or in which the errors in determining the magnetic field were too large.
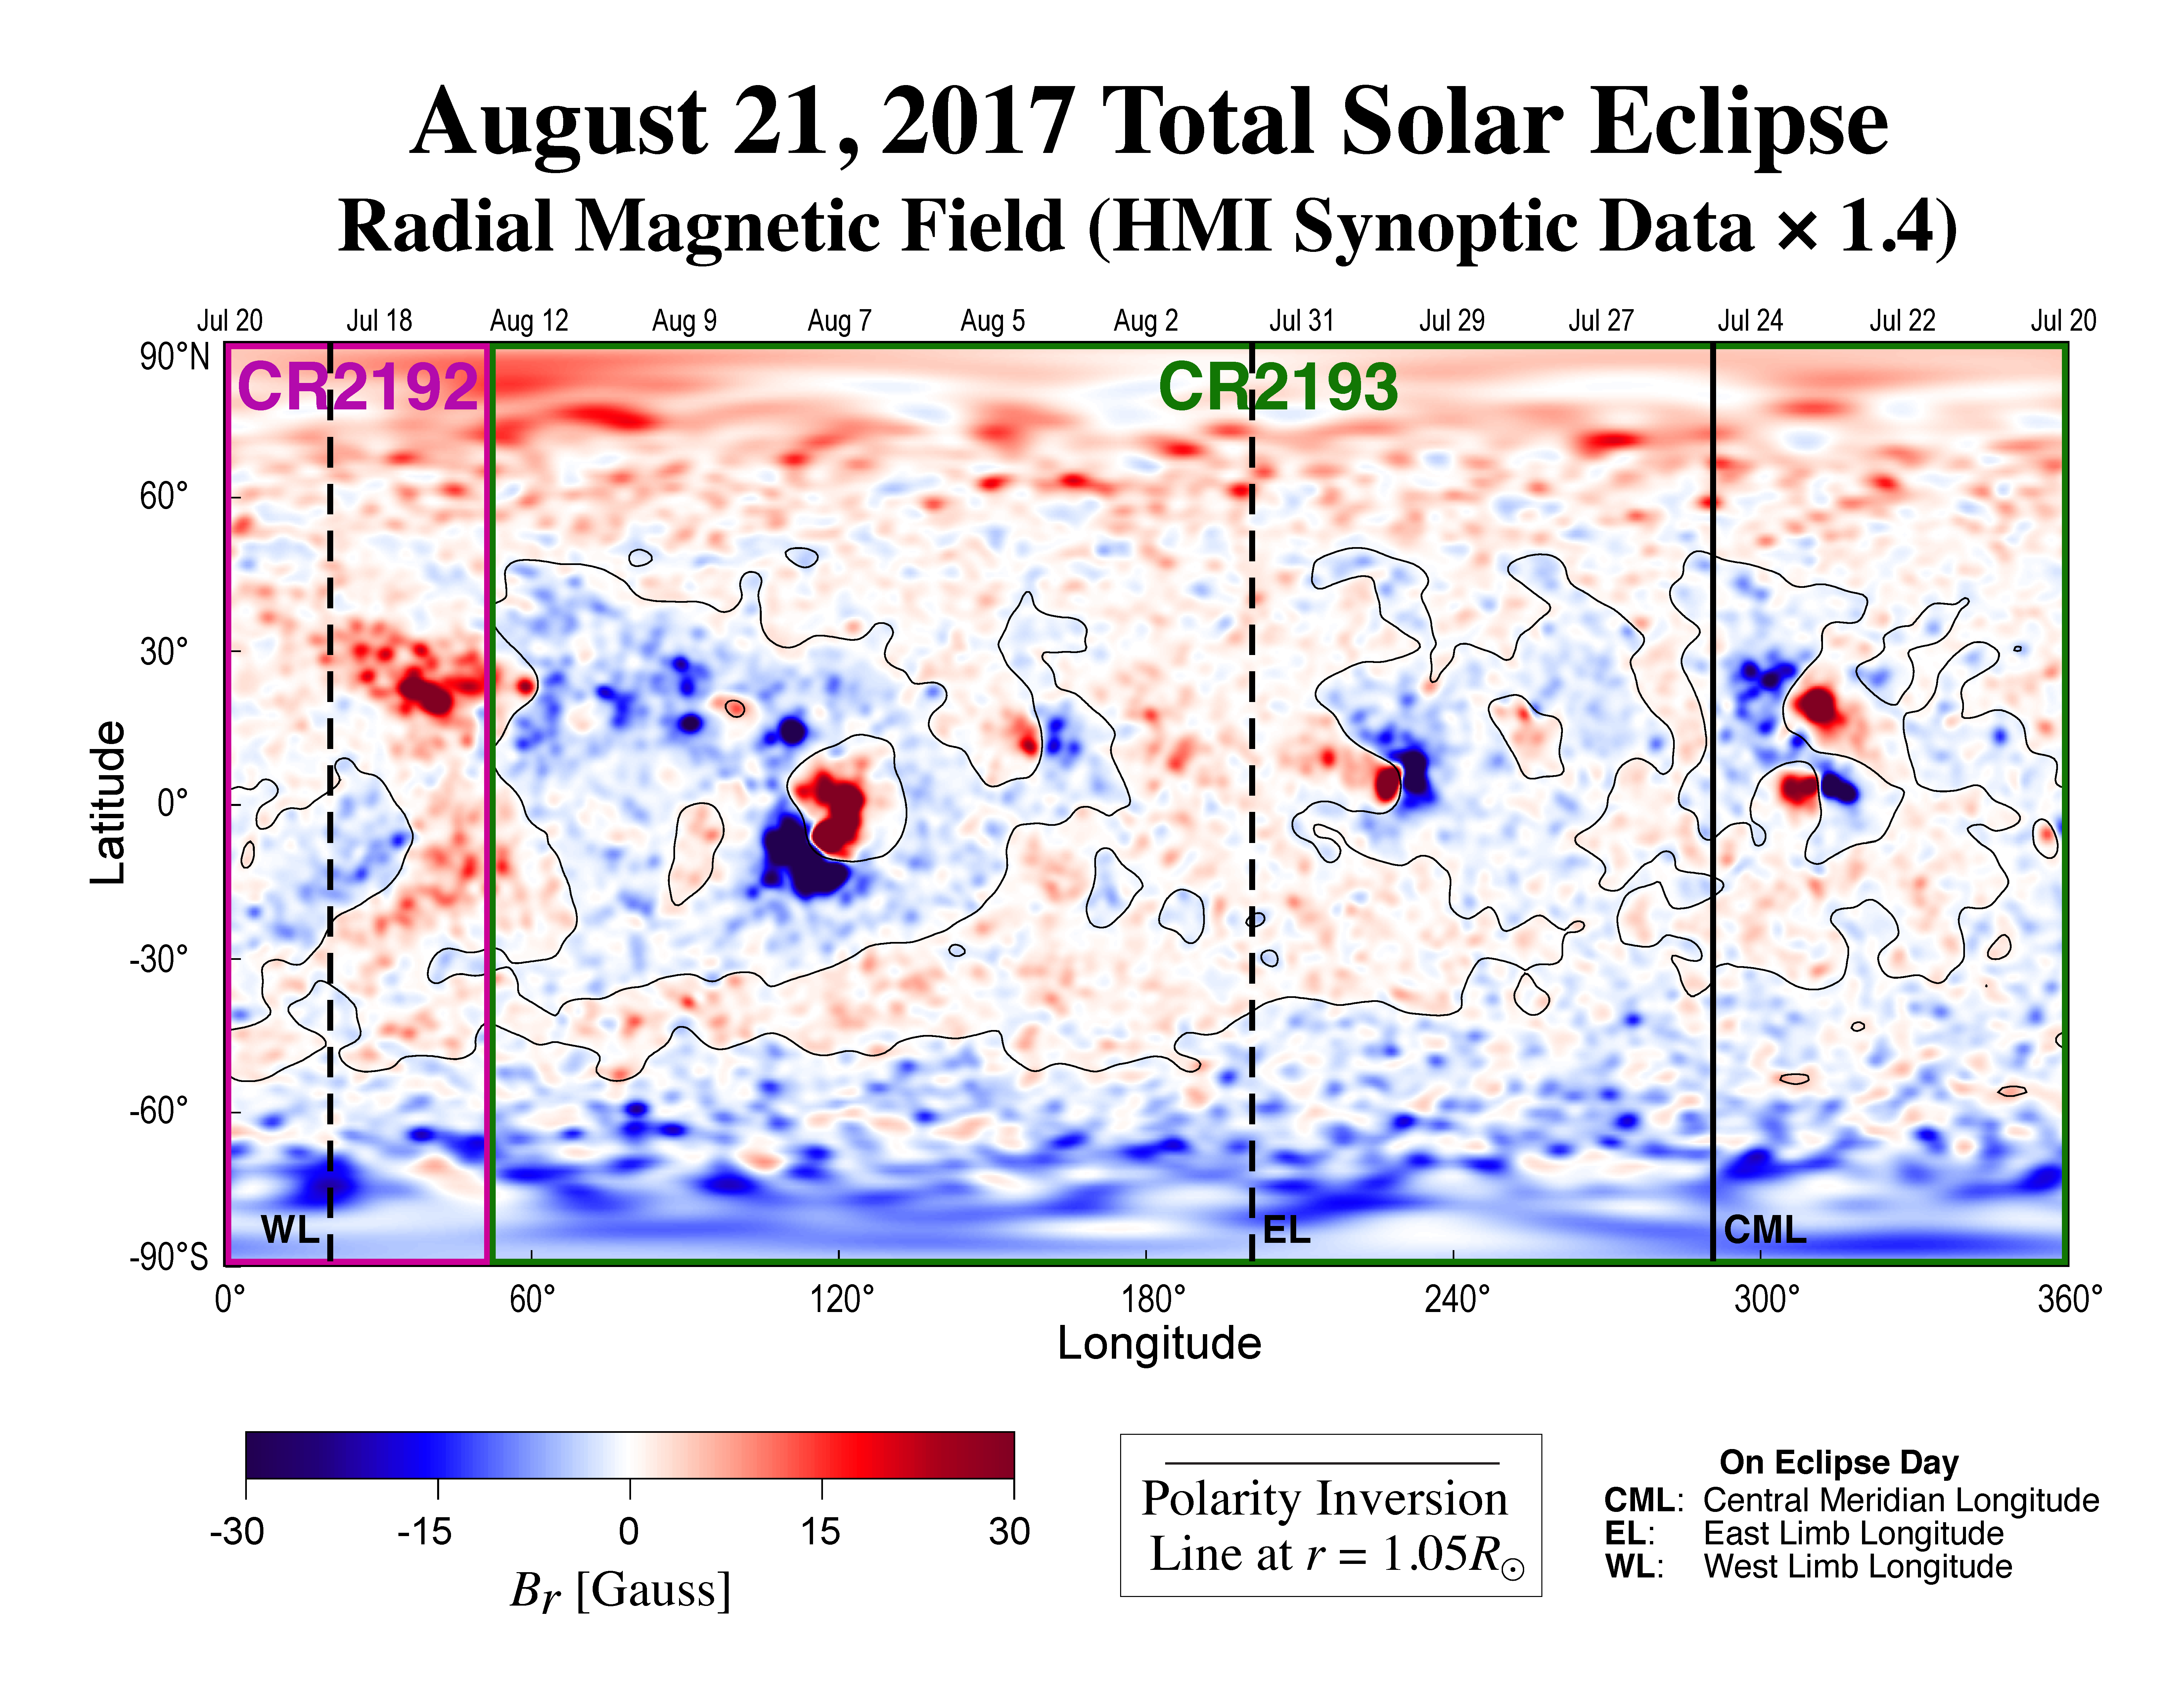
For our final eclipse prediction we used the data in this last image, which is a combination of a synoptic map of Carrington rotation 2192 (longitudes 0 to 51 degrees), and data from the "Near Real Time" synoptic map of Carrington rotation 2193 (longitudes from 51 to 360 degrees). These correspond to data measured from July 20, 2017 up to August 11, 2017 at 12:00UT. The data in the polar regions was filled with random concentrations of flux, with properties similar to those in the measured high-latitude fields, and with total magnetic flux matching values from past time periods during which the solar poles were visible. The magnetic field that was used in our MHD calculation for the final prediction is shown in the image below. We multiplied the Br inferred from HMI by the factor of 1.4 to account for the difference in magnetic field strengths measured by the MDI magnetograph on SOHO and HMI [Y. Liu et al., Solar Physics, 279, 295-316 (2012)], since several of our previous eclipse predictions used MDI data, and our model parameters were benchmarked to MDI data.