
Synchronic EUV and coronal hole maps
Here we provide synchronic EUV and coronal hole (CH) maps from 6/10/2010 to 8/18/2014 at 6-hour cadence. See below for detailed instructions on accessing the data.
Instructions
Use the calendar to select the desired day and hour and the closest data to that time will be shown (the time shown is for the STEREO-A image (the data times for the other spacecraft are within \(\pm\)10 minutes).
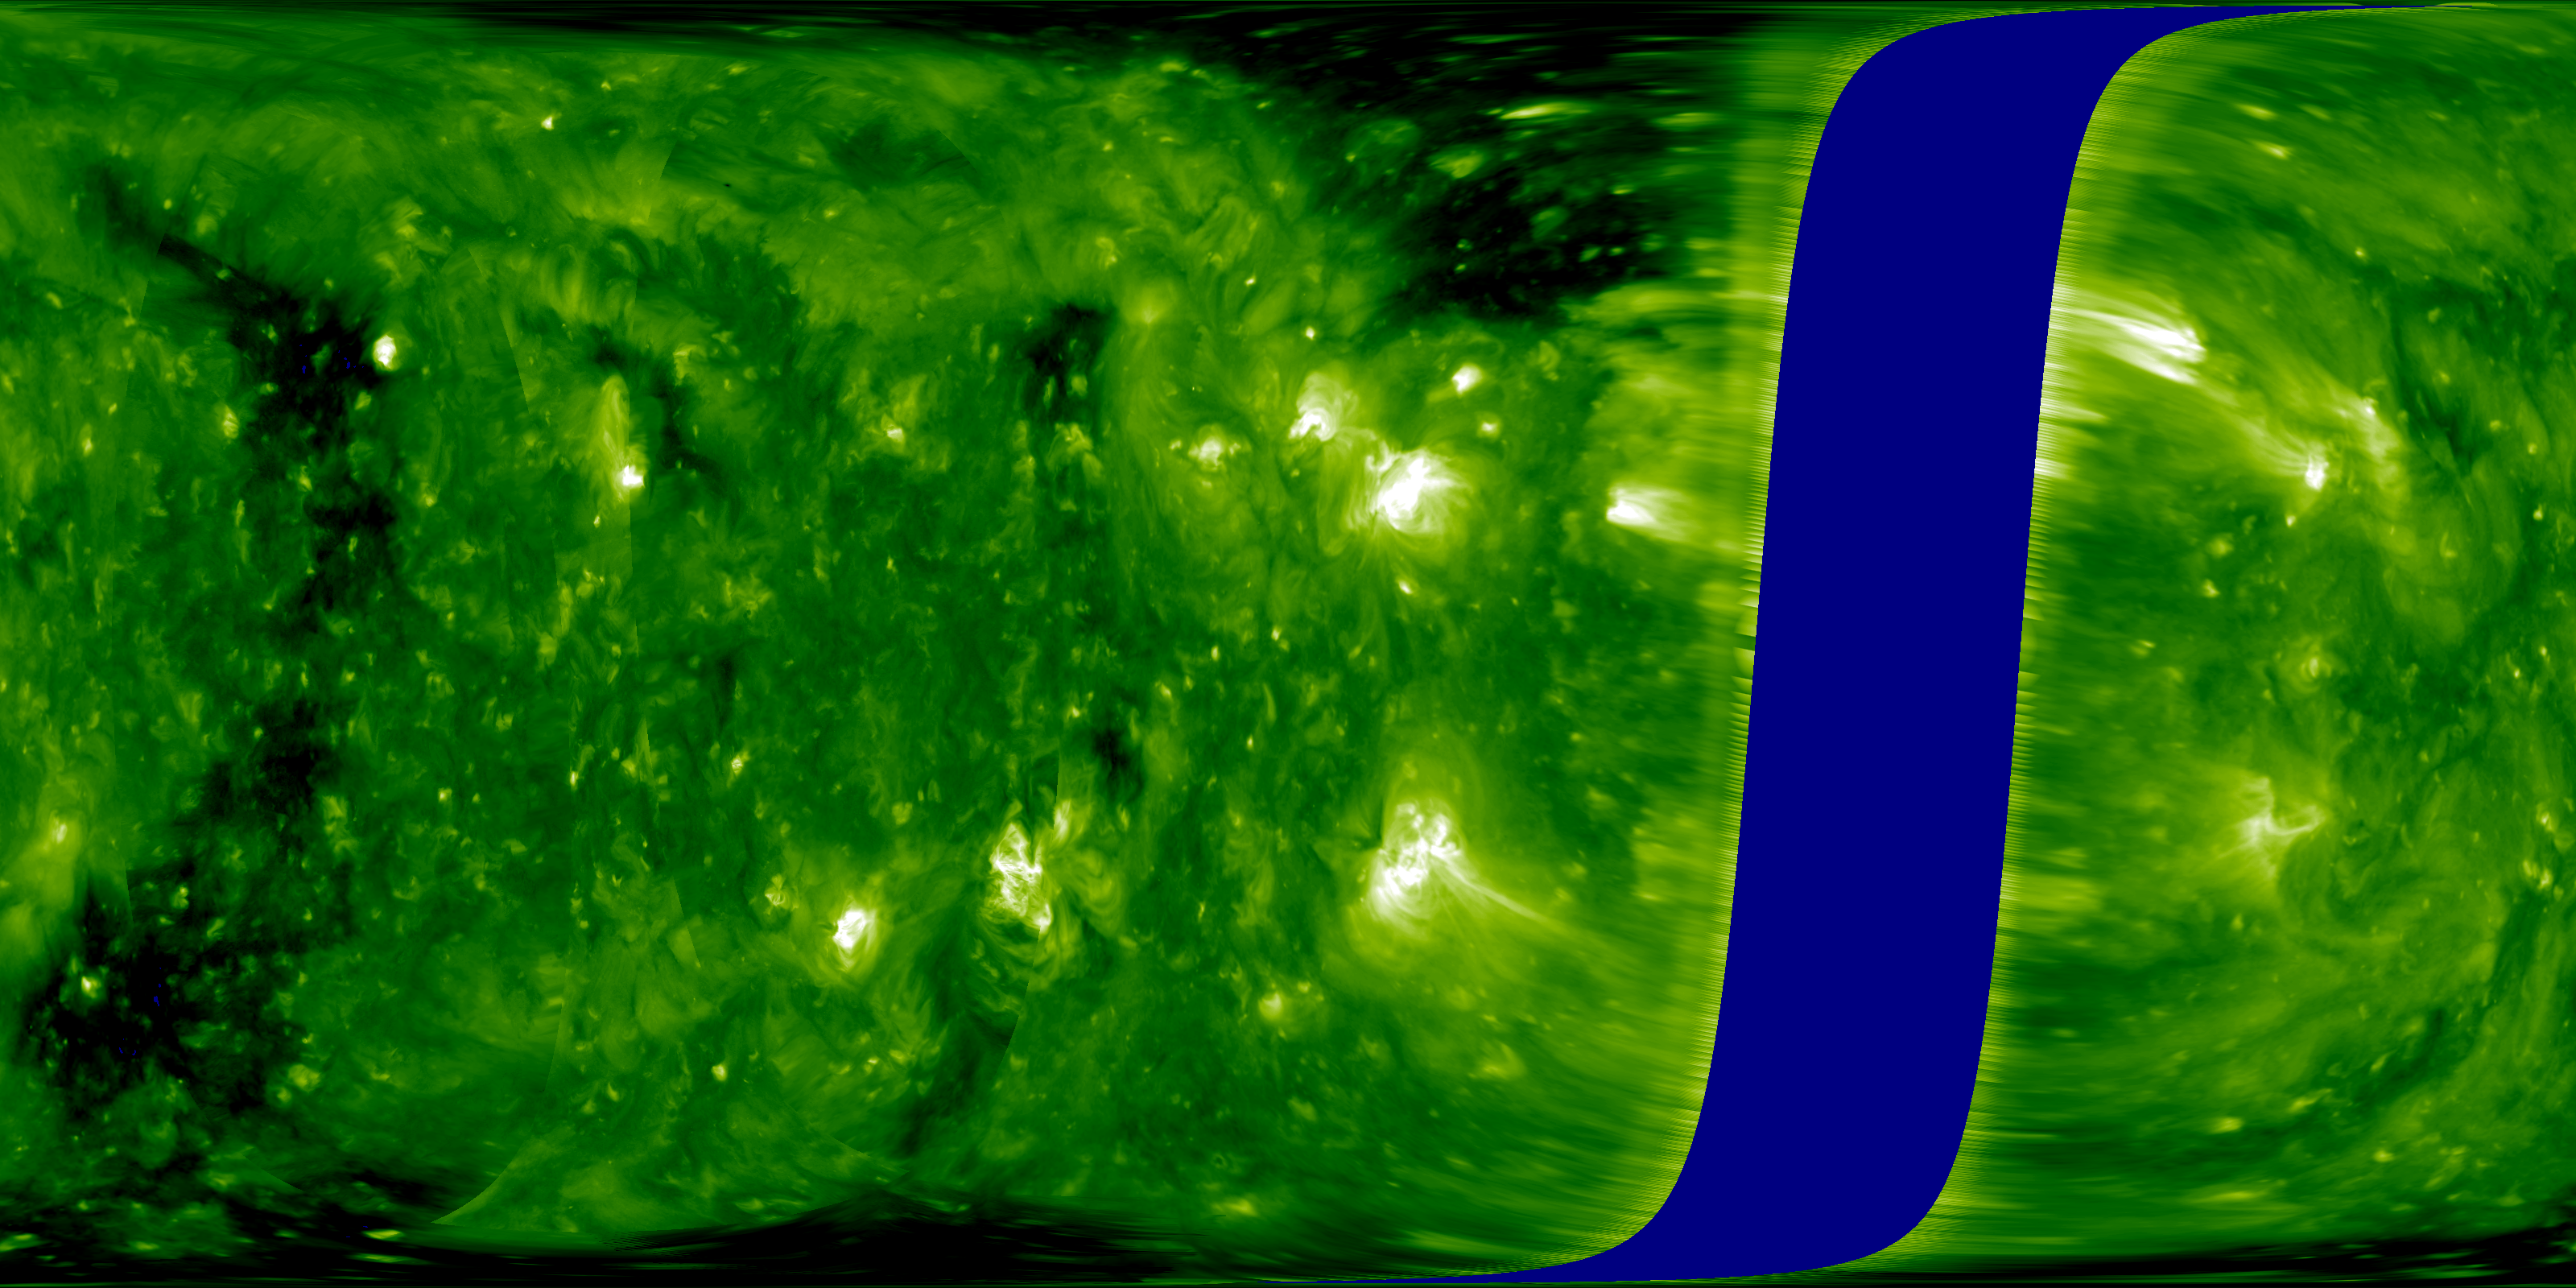
The coronal hole map can be previewed as a contour over the EUV map, as a binary map, or as a instrument/quality colored map (see below) by selecting the appropriate radio button. Clicking on the preview image will display a png of the full-resolution (3200x1600) EUV map. In all maps, the dark blue (or black) regions indicate areas where no data was available from any of the three spacecraft.
The maps are downloadable in hdf4 format, and reader scripts are provided for IDL and MATLAB by clicking the links above. The EUV data is stored in single precision floating-point format with a flag value of -9999 to represent regions of no data. The coronal hole data is stored in int8 (byte) format with values 0 and 10 representing no coronal hole and no-data regions respectively. Coronal holes are indicated by values 1-9, where the values indicate the instrument which observed the data as well as the `quality' of the data as follows:
| Data quality | |||
| Instrument | Good | Fair | Bad |
| STEREO-A | 1 | 2 | 3 |
| STEREO-B | 4 | 5 | 6 |
| AIA | 7 | 8 | 9 |
For all map images and data, an EUV disk image radius of \(R_0=1.01\;R_{\odot}\) is assumed and used for processing and mapping.