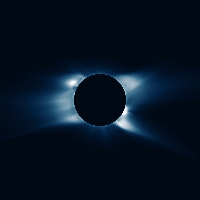
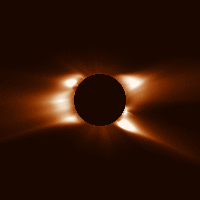
Brightness (Newkirk Filter)
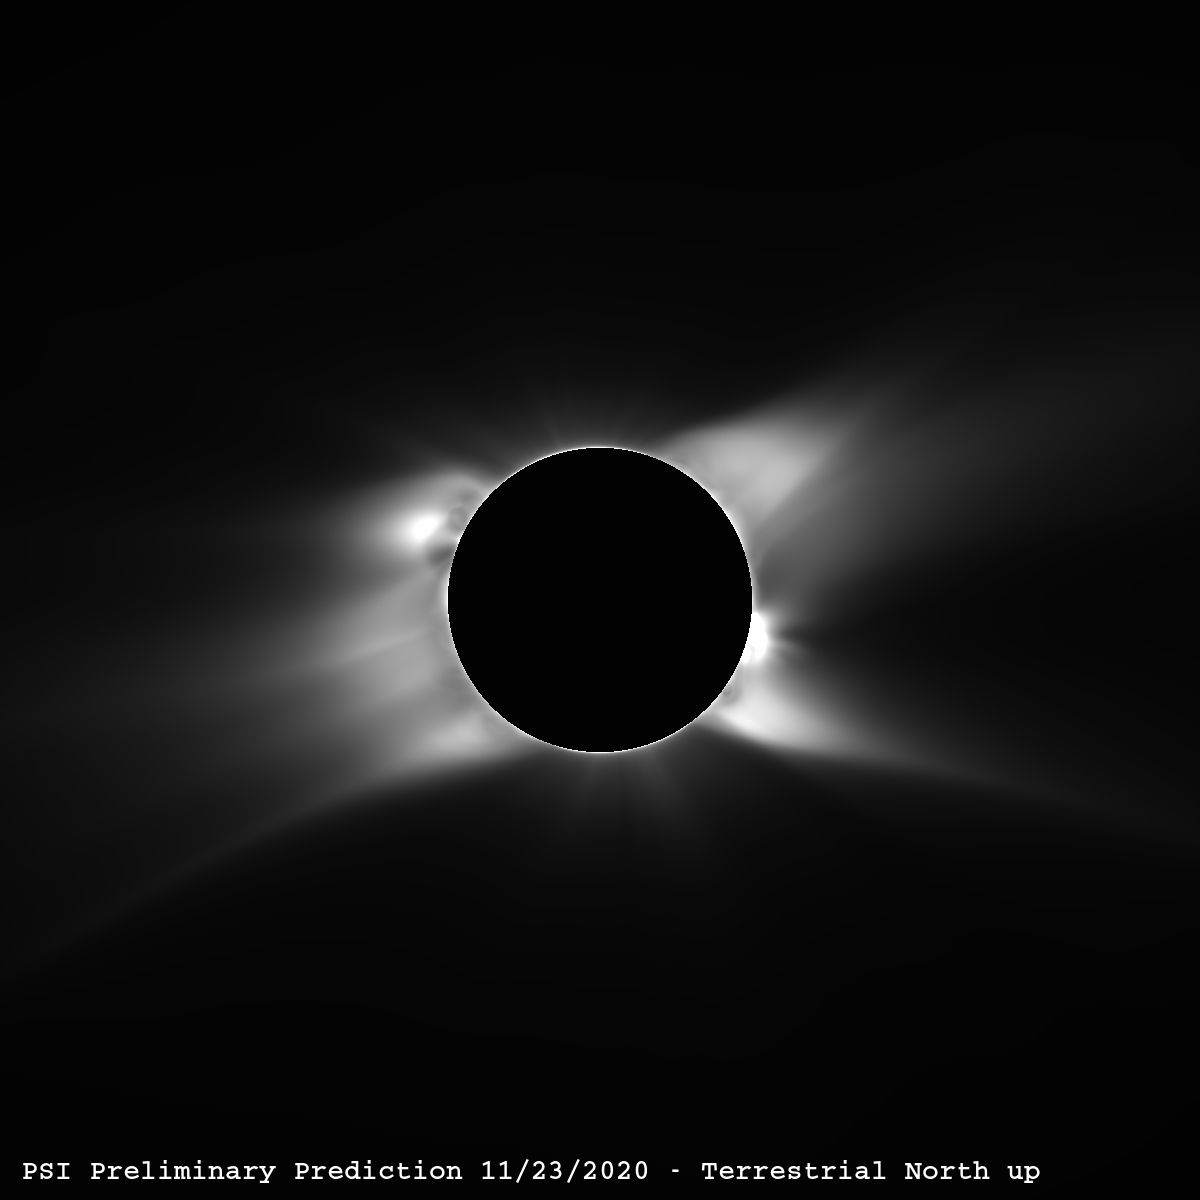
Log Brightness (Unsharp Masked)
This is our preliminary prediction of the solar corona for the December 14, 2020 total solar eclipse. The above images show two versions of the predicted white light brightness in the corona. The left image shows an image processed to simulate what would be seen when using a "Newkirk" radially graded filter. The image on the right is the brightness on a log scale, sharpened using an "Unsharp Mask" filter. These are two different attempts to approximate what the human eye might see during the solar eclipse. For this eclipse we are showing brightness for the primary prediction, as this is closer to what an observer sees with their naked eye. In past eclipse predictions we showed polarized brightness, which may be more useful for scientific purposes. The polarized brightness can be viewed here .
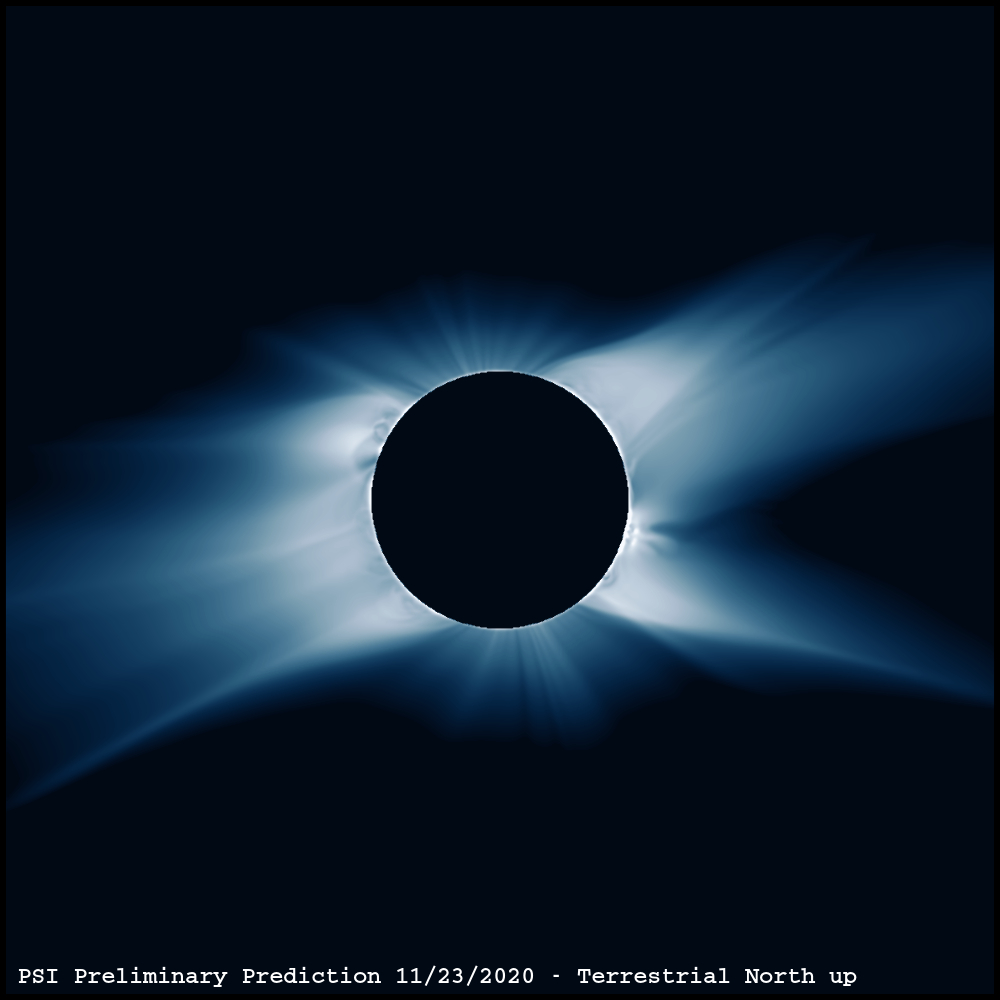
The image below on the left shows a digital processing of the brightness using a "Wavelet" filter to bring out the details in the image. The image on the right shows traces of selected magnetic field lines from the model. Additional details about the eclipse and our prediction model are given below.
Brightness (Wavelet Filtered)

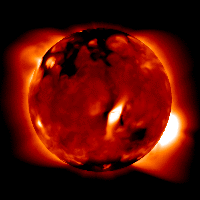
Magnetic Field Lines
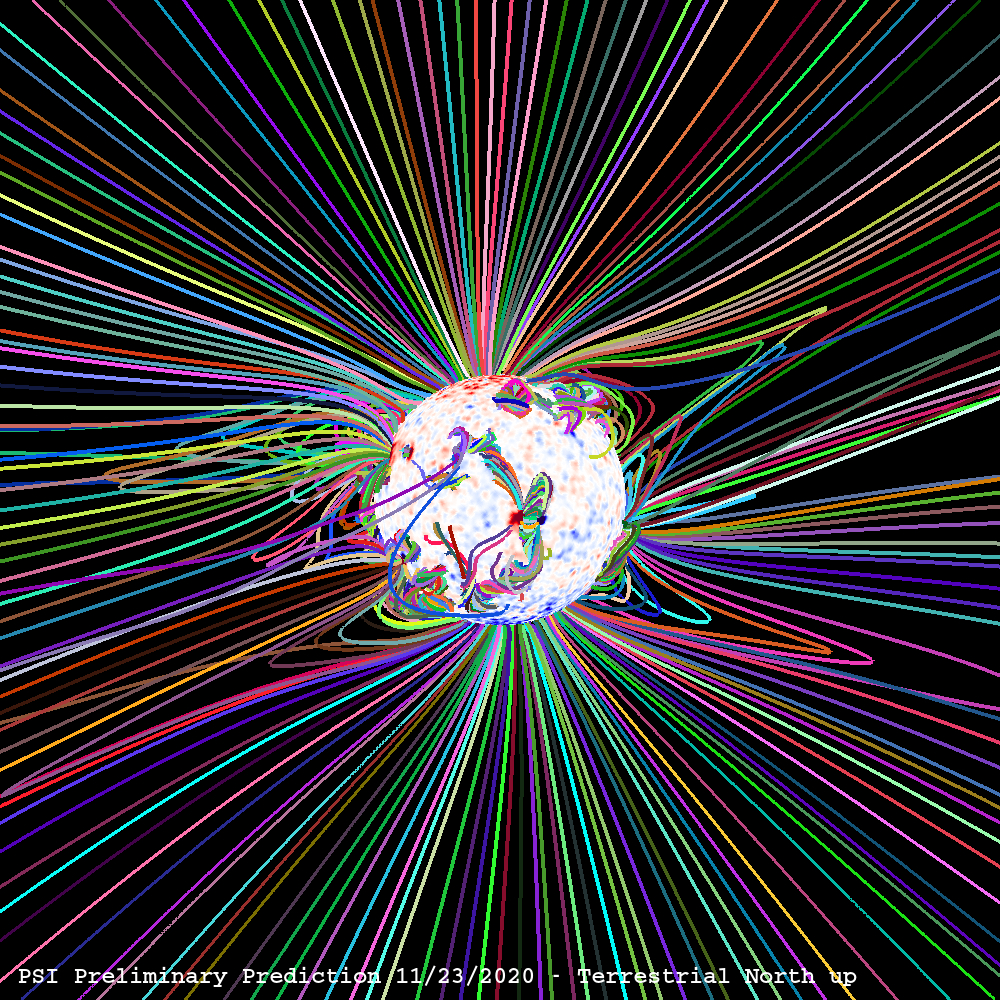
These images are aligned so that terrestrial (geocentric) north is up, for the time of totality (16:03 UT) near Villarrica, Chile. This is the view of the Sun that would be seen by an observer on Earth with a camera aligned so that vertical is toward the Earth's north pole. Because the eclipse will be visible high in the sky in the southern hemisphere, many of the photographs you see may have the south pole near vertical instead. Here is the perspective for a spectator on the ground in Villarrica looking up. In the magnetic field line image, the Sun's surface shows the intensity of the radial component of the photospheric magnetic field. The brightest colors show the location of active regions (strong magnetic fields). Images in a coordinate system aligned with solar north are also available.
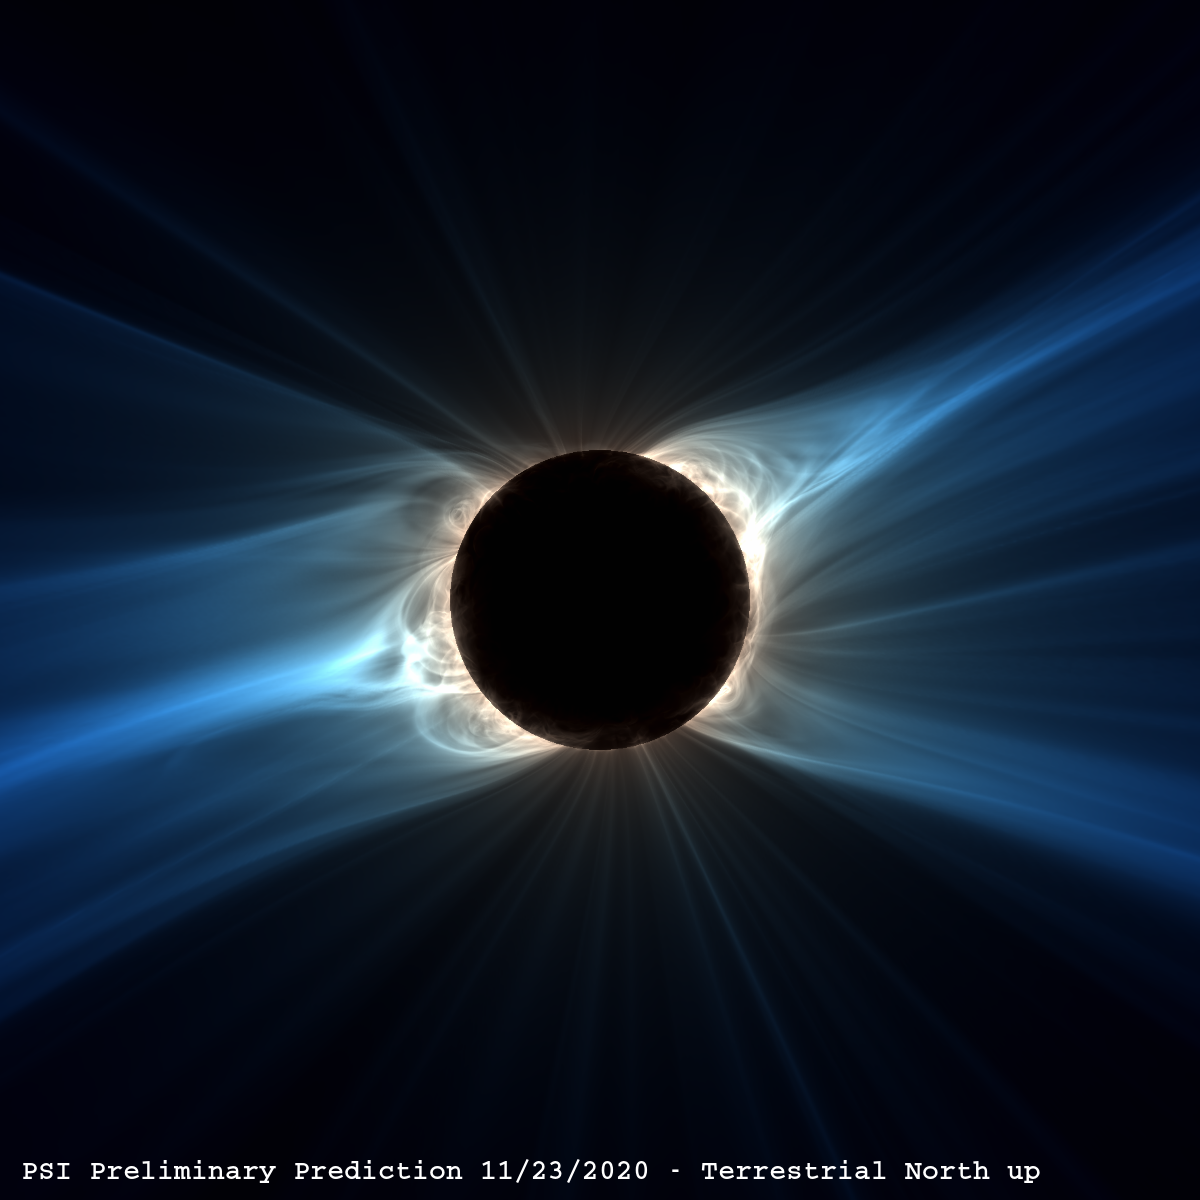
Volume-rendered Squashing Factor Q
(Eclipse Day View)
Volume-rendered Squashing Factor Q
(Rotating Movie)
The last set of images show a special visualization of the three-dimensional (3D) magnetic field. By tracing magnetic field lines at extremely high resolution, we can calculate a 3D map of the so-called squashing factor - a scientific measure designed to indicate the presence of complex structuring in the magnetic field. We then integrate the map along the line-of-sight, with special weightings to create a composite that resembles solar eclipse images. This is intended to highlight the inherent complexity of the Sun's magnetic field and its intimate connection to visible emission from the solar corona.
Modeling the Corona for the Total Solar Eclipse
On December 14th, 2020, a total eclipse of the Sun will be visible across the South Pacific, Chile, and Argentina. Over land, the eclipse will be visible quite high in the sky, staying just over 70 degrees in azimuth. The longest duration of totality will be about 2 minutes and 10 seconds, occurring in central Argentina. To see an interactive map of the path of the eclipse, please visit Xavier Jubier's interactive Google map. Also see Fred Espenak's Eclipse website for a detailed narrative of the eclipse circumstances and additional maps.
On November 12, 2020, we started an MHD computation of the solar corona, in preparation for our prediction of what the solar corona will look like during this eclipse. We used data measured by the HMI magnetograph aboard NASA's SDO spacecraft. We used a combination of HMI synoptic maps, including data for Carrington rotation 2236 combined with data from a part of Carrington rotation 2237 measured up to 12:00 UTC on November 12, 2020. You can read the details about the evolution of the photospheric magnetic field that was used to make our prediction, and how we accounted for unobserved data at the poles. This preliminary prediction of the state of the solar corona during the eclipse was posted on November 23, 2020.
Our prediction is based on a magnetohydrodynamic model of the solar corona with a wave-turbulence-driven (WTD) methodology and improved energy transport. New to this eclipse, our calculation computes both the proton and electron temperatures separately, allowing these temperatures to collisionally decouple as they do in the solar wind. We have applied the WTD methodology to heat the corona previously, first in our prediction for the August 21, 2017 eclipse. This particular simulation employs other updates to our technical approach for the WTD formalism and the heating parametrization to better match the current solar conditions. This simulation is also quite large for this type of calculation, using 66 million grid points. For details about our model, please see our MAS Model Webpage and publications.
As we did for the August 21, 2017 eclipse and July 2, 2019 eclipse, we introduced magnetic shear along polarity inversion lines (PILs - lines separating positive and negative polarity regions) where filament channels were observed in EUV emission by SDO/AIA. This is a well-known feature of large-scale coronal magnetic fields. The handedness of the shear was estimated using the hemispheric rule in quiet sun, and by visual inspection of AIA images for active regions (see Energization). The introduction of shear qualitatively changes the shape of the streamers and the connectivity of the underlying fields, and increases the free magnetic energy in the corona. It can even produce a CME!
From our model, we can predict quantities that can be observed directly. We provide images of the total brightness (B) and the polarized brightness (pB). The B resembles what is seen by the naked eye. However, pB is the more scientifically useful quantity. Traditionally, pB has been used to separate light scattered by the K-corona and the F-corona. The K-corona is the photospheric light scattered by electrons in the corona, while the F-corona is the photospheric light scattered by dust, which is unpolarized. Note that we do not model the F-corona so its contribution to B is not included.
We can also estimate emission in extreme ultraviolet (EUV) wavelengths and X-rays. The EUV emission can be compared with solar observations from the AIA instrument on SDO. X-ray emission can be compared with solar observations from the XRT instrument on Hinode.
You can read the technical details about the calculations that were used to make our predictions.
Additional Materials
Brightness
Polarized Brightness
Coronal Emission
Magnetic Field Lines
Publications
For technical details about our model, please see the following publications:
- Z. Mikić, J. A. Linker, D. D. Schnack, R. Lionello, and A. Tarditi, Magnetohydrodynamic Modeling of the Global Solar Corona, Physics of Plasmas, 6, 2217 (1999).
- Z. Mikić, J. A. Linker, P. Riley, and R. Lionello, Predicting the Structure of the Solar Corona During the 11 August 1999 Total Solar Eclipse, in The Last Total Solar Eclipse of the Millennium, Proceedings of the Conference held in Istanbul, Turkey, 13-15 August, 1999 (W. Livingston and A. Ozguc, eds.), ASP Conference Series, Vol. 205, p. 162 (2000).
- Z. Mikić, J. A. Linker, R. Lionello, P. Riley, and V. Titov, Predicting the Structure of the Solar Corona for the Total Solar Eclipse of August 1, 2006, in Solar and Stellar Physics Through Eclipses (O. Demircan, S. O. Selam, and B. Albayrak, eds.), ASP Conference Series, Vol. 370, p. 299 (2007).
- R. Lionello, J. A. Linker, and Z. Mikić, Multispectral Emission of the Sun During the First Whole Sun Month: Magnetohydrodynamic Simulations, Astrophys. J., 690, 902 (2009).
- V. Rušin, M. Druckmüller, P. Aniol, M. Minarovjech, M. Saniga, Z. Mikić, J. A. Linker, R. Lionello, P. Riley, and V. S. Titov, Comparing Eclipse Observations of the 2008 August 1 Solar Corona with an MHD Model Prediction, Astron. Astrophys., 513, A45 (2010).
- P. Riley, J. A. Linker, R. Lionello, and Z. Mikić, Corotating interaction regions during the recent solar minimum: The power and limitations of global MHD modeling, Journal of Atmospheric and Solar-Terrestrial Physics, 83, 1-10 (2012).
- R. Lionello, M. Velli, M., C. Downs, J. A. Linker, Z. Mikić, and A. Verdini, Validating a Time-Dependent Turbulence-Driven Model of the Solar Wind, Astrophys. J., 784, 120 (2014).
- C. Downs, R. Lionello, Z. Mikić, J. A. Linker, and M. Velli, Closed-Field Coronal Heating Driven by Wave Turbulence, Astrophys. J., 832, 180 (2016).
- Mikić, Zoran, Downs, Cooper, Linker, Jon A., Caplan, Ronald M., Mackay, Duncan H., Upton, Lisa A., Riley, Pete, Lionello, Roberto, Török, Tibor, Titov, Viacheslav S., Wijaya, Janvier, Druckmüller, Miloslav, Pasachoff, Jay M., Carlos, Wendy, Predicting the corona for the 21 August 2017 total solar eclipse, Nature Astronomy 10.1038/s41550-018-0562-5.
- Riley, Pete, Downs, Cooper, Linker, Jon A., Mikic, Zoran, Lionello, Roberto, and Caplan, Ronald M., Predicting the Structure of the Solar Corona and Inner Heliosphere during Parker Solar Probe's First Perihelion Pass, The Astrophysical Journal 874, L15, 2019.
Other Resources for the Solar Eclipse
- NASA's Eclipse website
- Fred Espenak's Eclipse website
- Shadow and Substance
- Xavier Jubier's 2020 Total Eclipse Interactive Google Map
- IAU Working Group on Eclipses
Acknowledgments
Our work is supported by NASA (Heliophysics Supporting Research and Living with a Star programs), AFOSR, and NSF. We are grateful to NASA's Advanced Supercomputing Division (NAS) for an allocation on the Pleiades and Electra supercomputers, and the Extreme Science and Engineering Discovery Environment (XSEDE) for allocations on Stampede2 at the Texas Advanced Computing Center (TACC) and Comet at the San Diego Supercomputer Center (SDSC), which allowed us to complete the eclipse prediction simulations shown here. We also thank the SDO/HMI team of the Solar Physics Group at Stanford University for their support in providing timely access to HMI Synoptic magnetograph data.