 Visible and Infrared Line Emission for the December 4, 2021 Total Solar Eclipse
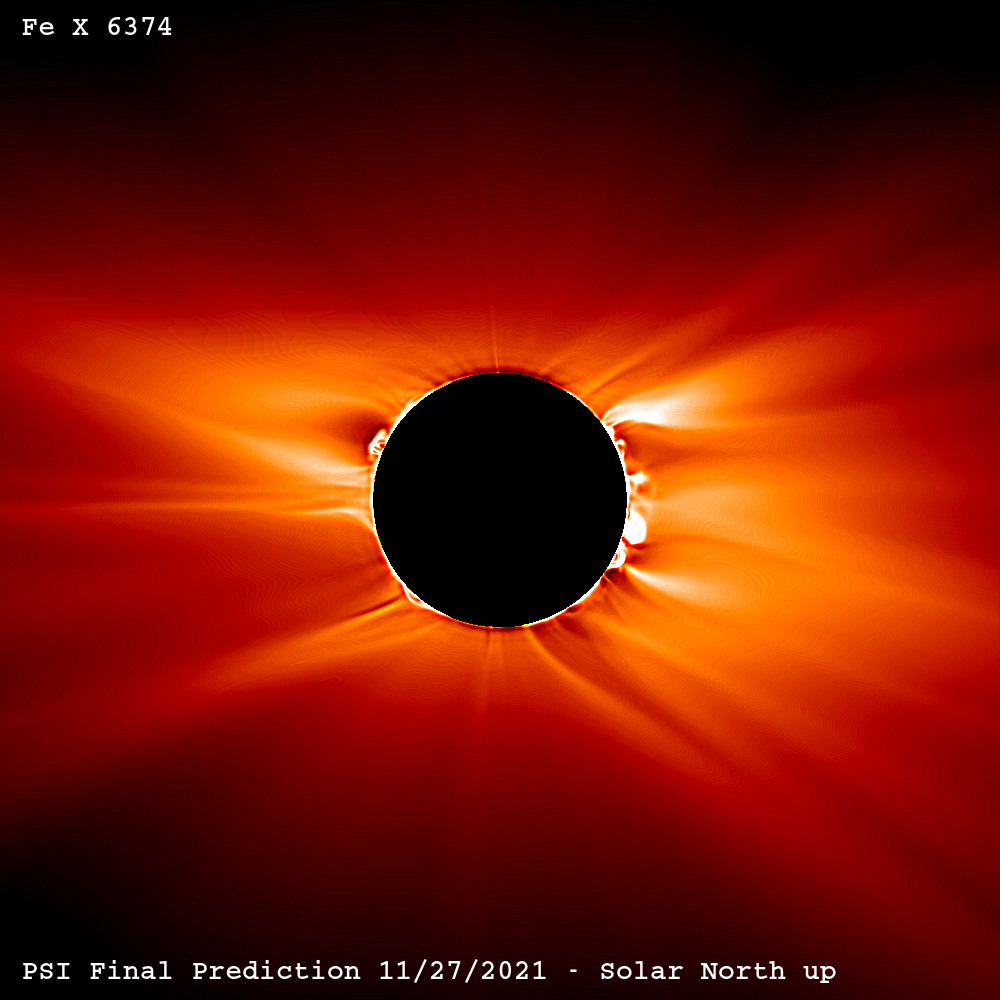
Fe X 6374 Å
(Radially Filtered, Unsharp Masked)
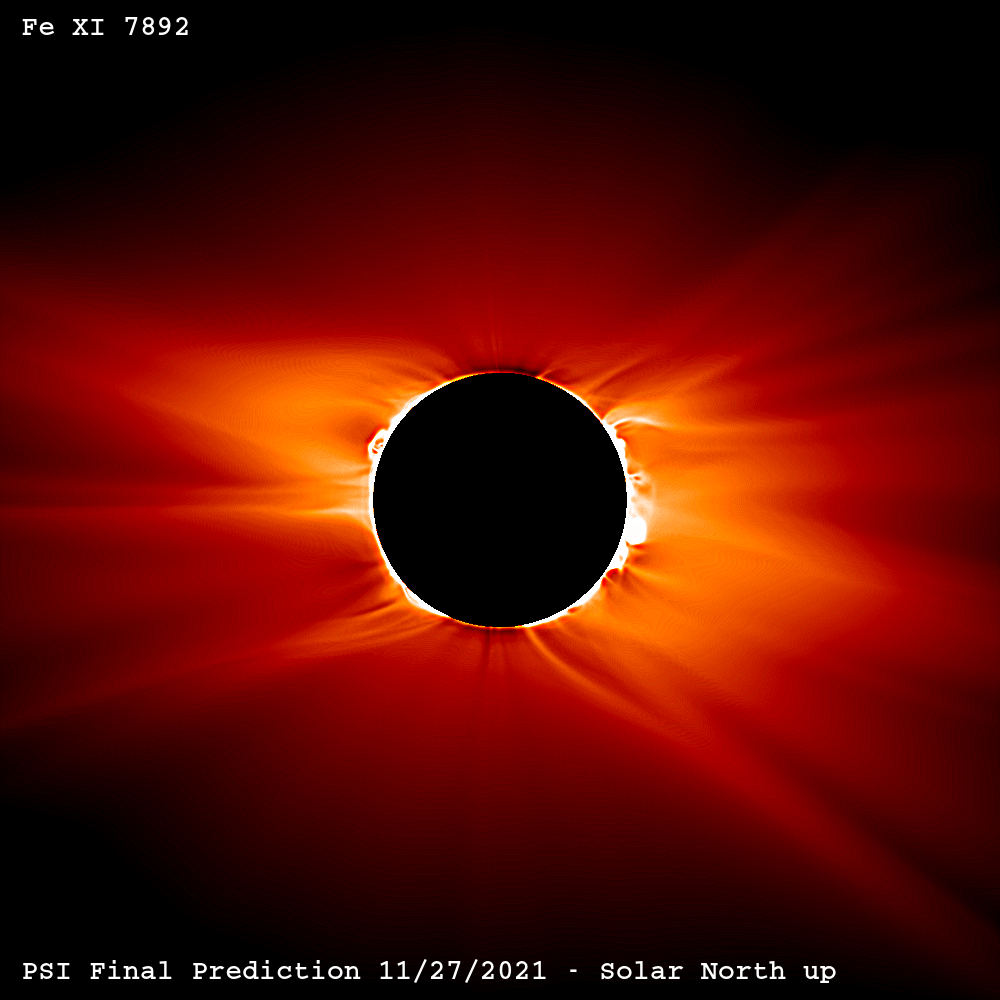
Fe XI 7892 Å
(Radially Filtered, Unsharp Masked)
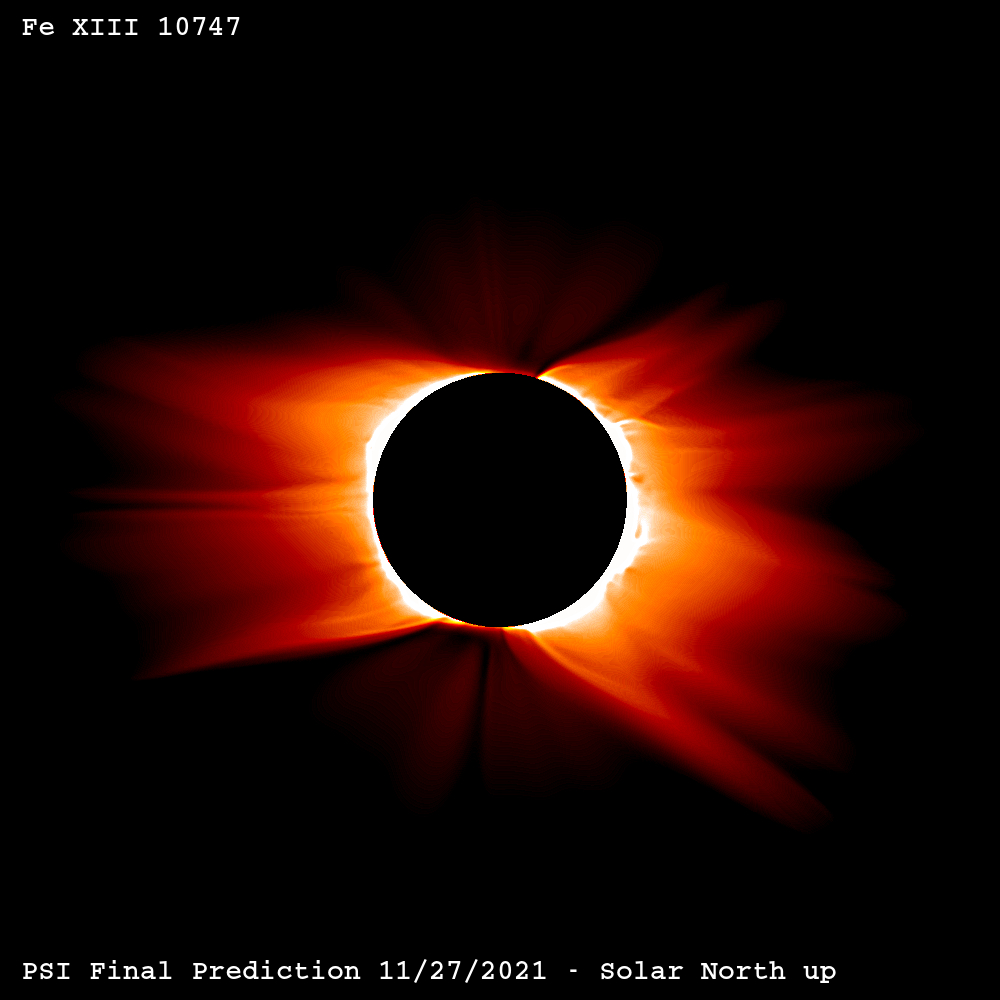
Fe XIII 10747 Å
(Radially Filtered, Unsharp Masked)
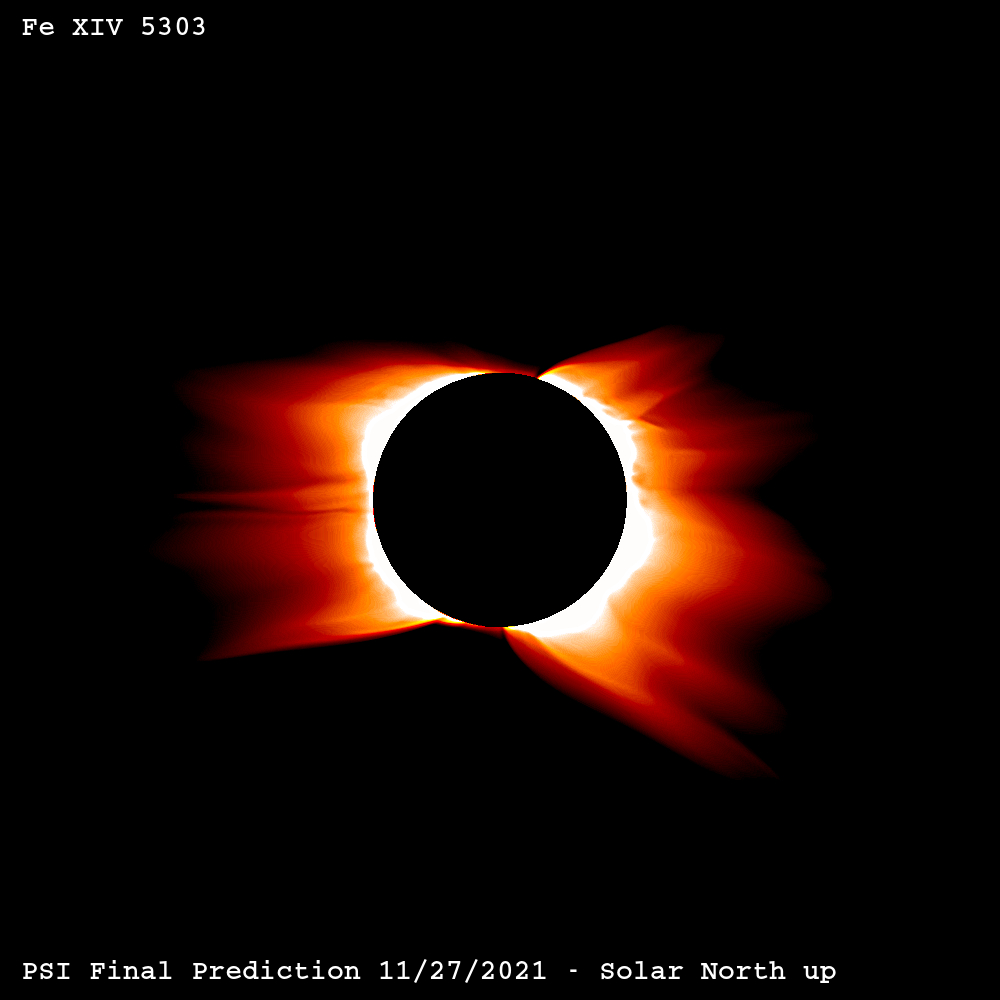
Fe XIV 5303 Å
(Radially Filtered, Unsharp Masked)
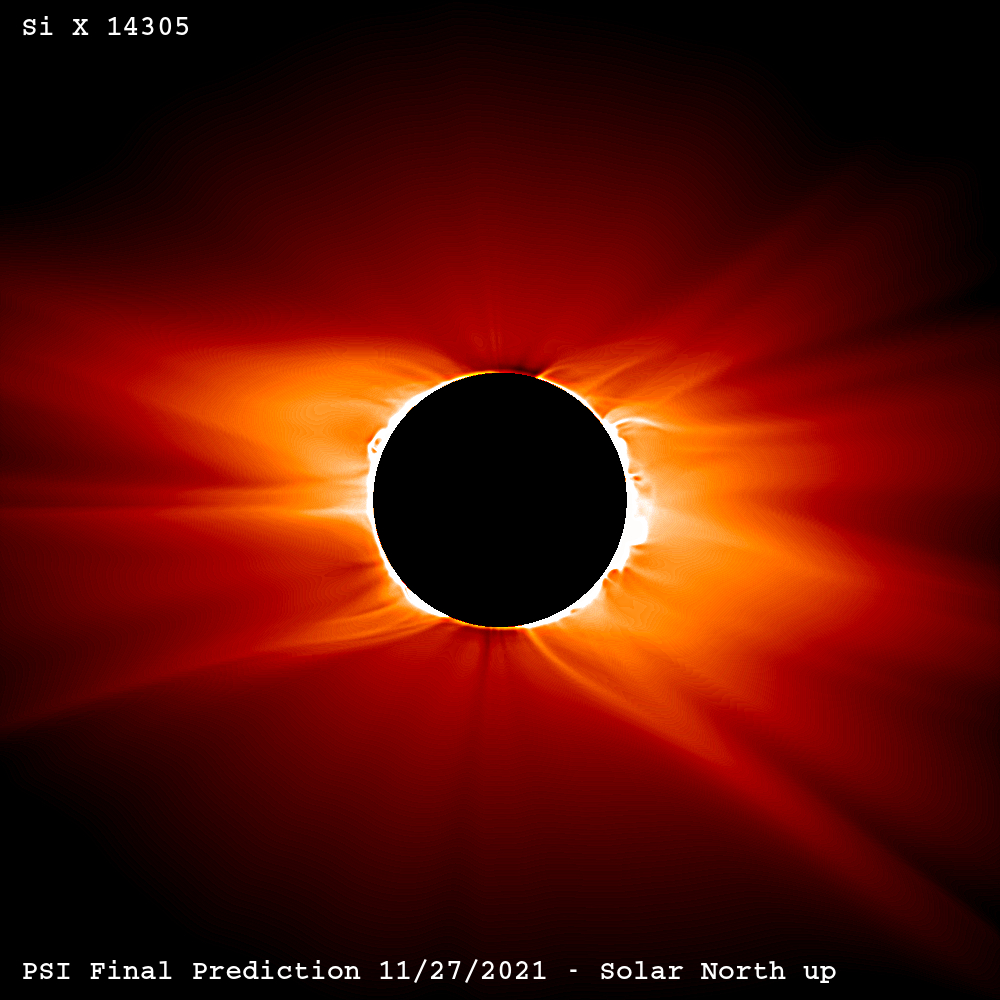
Si X 14305 Å
(Radially Filtered, Unsharp Masked)
S XI 13928 Å
(Radially Filtered, Unsharp Masked)
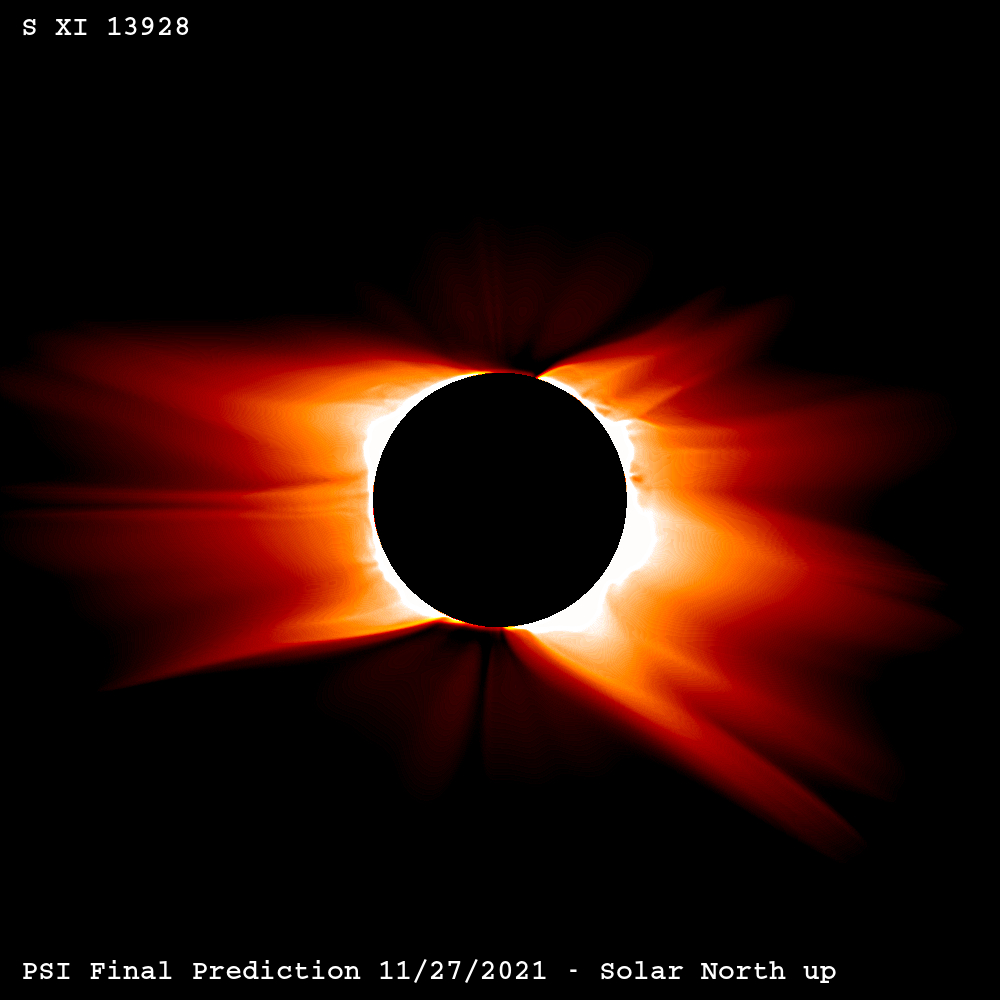
Here we show predictions for several strong coronal emission lines in the visible and infrared. Unlike emission in extreme ultraviolet (EUV) wavelengths and X-rays, these lines tend to have strong contribution from photoexcitation, where emission from the solar surface is absorbed and re-radiated by hot coronal ions at specific wavelengths. The iron (Fe) ionization states are ordered by increasing formation temperature. Click on an image and use the slideshow feature to watch how the appearance of the highly stratified corona changes with plasma temperature.
Because of their unique sensity to density, temperature, and solar radiation, these lines can be very useful for studying the solar corona. In fact, it was the bright line at 5303 Å, known as the coronal green line, that gave the first hints that million degree plasma must be present somewhere in the solar atmosphere. This is because the line can only be formed by a highly ionized state of iron (Fe 13+, or in astronomical notation: Fe XIV). Because emission from the photosphere is so much brighter than these coronal emission lines, they are often studied using coronagraphs, from space, or during total solar eclipses.
The above images have been highly processed, using a radial gradient filter and unsharp masking. Scientific versions of these images are also provided as raw unprocessed radiances (ergs/s/cm2/sr) in FITS format. The FITS headers have the typical metadata used in solar imaging measurements (i.e. compatible with SunPy).