
Measles
Measles
Spread by the highly contagious measles virus, Measles is an infectious disease that transmits via airborne particles and direct contact with facial secretions. High contagiousness combined with a long incubation period make Measles outbreaks particularly difficult to contain. A Measles vaccine was introduced in 1963. Prior to the vaccine, most children contracted Measles before the age of 15. Measles was then declared "eliminated" from the United States in 2000, but recent outbreaks in California (2015) and New York City (2018) suggest a growing susceptible population.
Our Contribution
We used the WHO measles database, which stretches back to 1980, and applied a wavelet transform to the annual data to see if we can identify any periodicity. The figure below shows incidence profiles for the five WHO regions: Africa, the Americas, South-East Asia, and Europe at a temporal cadence of one year. On the right are the associated wavelet transforms for these data. While not conclusive, there is some suggestion of a periodicity at ~9 years. Interestingly, there have been tentative connections with climate variability, and, in particular, the North Atlantic Oscillation (NAO) with several infectious diseases, including Lyme Borreliosis, Tularaemia, and Measles. The NAO is known to display decadal variability [1].
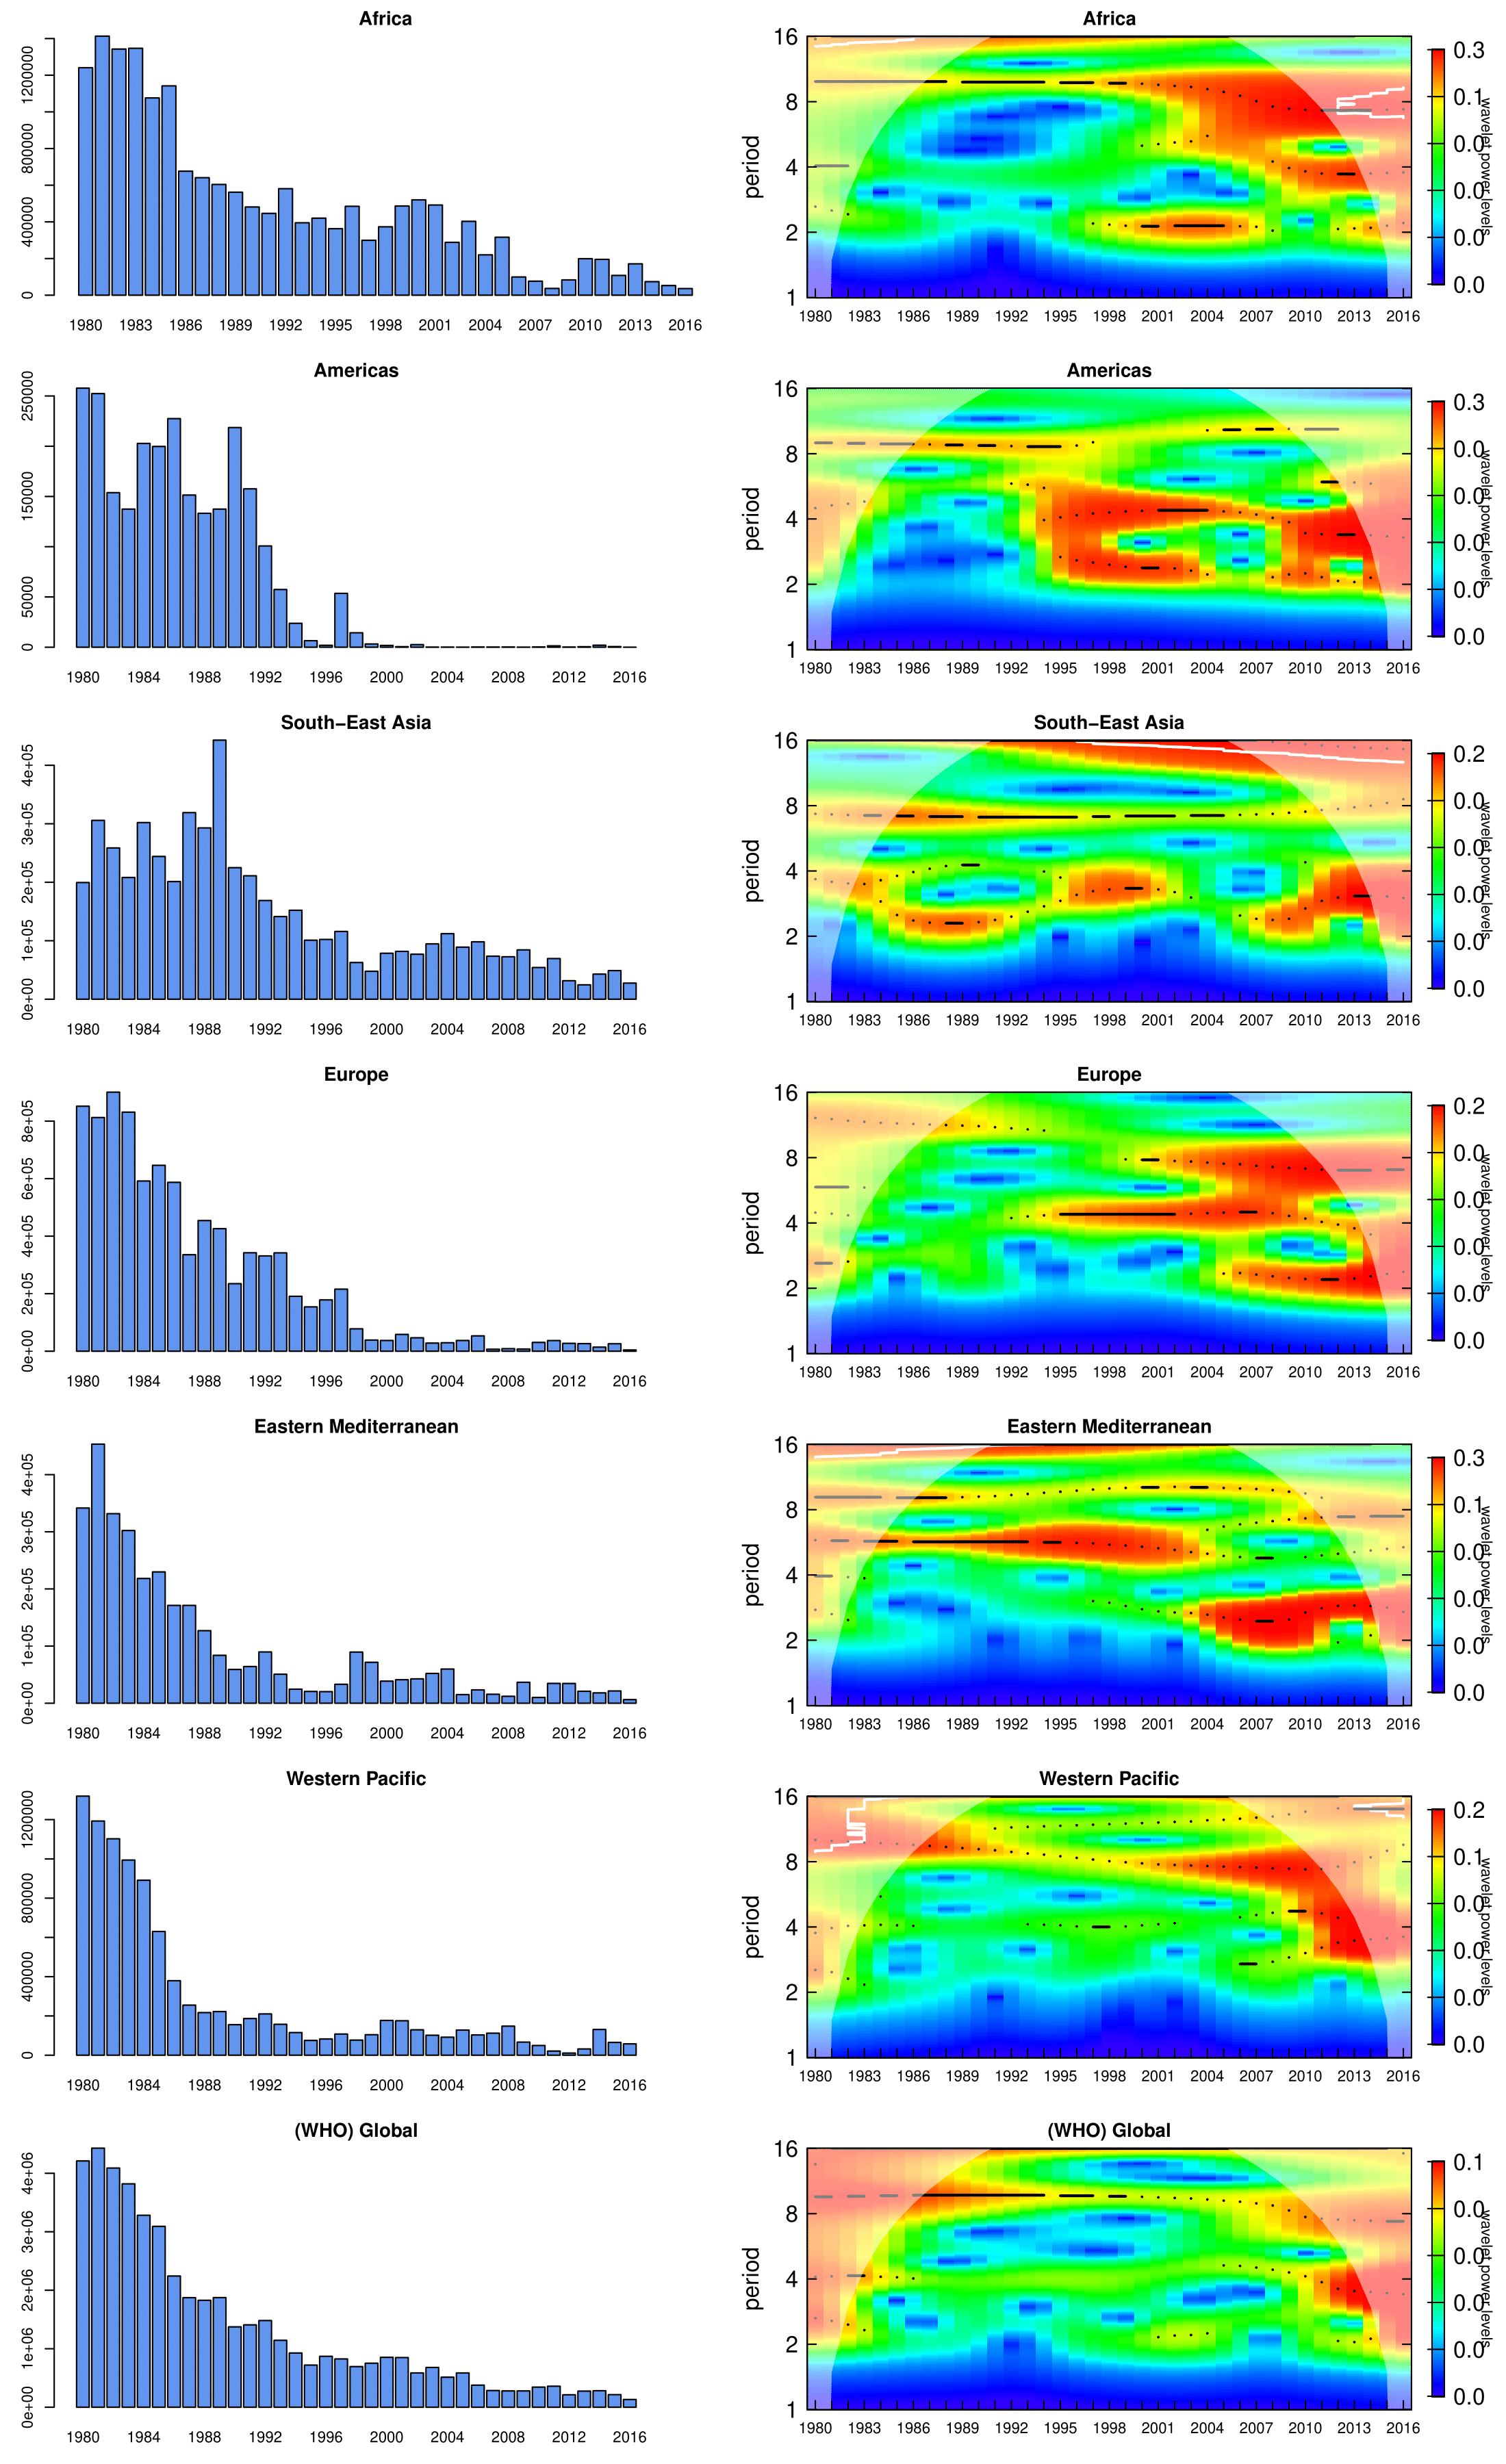
Figure 1: Measles data from the WHO for a selection of regions. The numbers of cases in Africa, the Americas, South-East Asia, and Europe are shown on the left. The associated wavelet analysis is shown on the right.
[1] Lima, M. A link between the North Atlantic Oscillation and measles dynamics during the vaccination period in England and Wales. Ecol. Let. 12, 302-314 (2009).
Most recently, we investigated the 2018 Measles outbreak in Israel. To estimate the final epidemic size, we developed a model that fits a polynomial to the cumulative incidence which was available on a weekly basis and at a fine spatial resolution. The results of the fit were then used in a parametric bootstrap procedure to make a forecast for the next few weeks. We used the results of the best fit to generate a cumulative incidence profile and incidence profile, with the latter being used to sample the new weekly number of cases for each week (from a Poisson distribution with the weekly incidence as the average of the distribution). These pseudo-profiles are then fitted, and the results of these fits are used to make the forecast.
Data
We have data from several Measles outbreaks that serve as training datasets for future activity: Micronesia (2014), California (2015), and
Israel (2018). Data can be viewed, analyzed, and downloaded from here:
http://www.predsci.com/id_data/
We have data from several Measles outbreaks that serve as training datasets for future activity: Micronesia (2014), California (2015), and
Israel (2018). Data can be viewed, analyzed, and downloaded from here:
https://apps.who.int/gho/data/view.main.1520_62
Future Plans
Currently, our team is re-focusing its efforts on better understanding the spread and severity of COVID-19, using the lessons learnt from influenza forecasting.