PVA 1.12.0
PVA: PyVisual Application
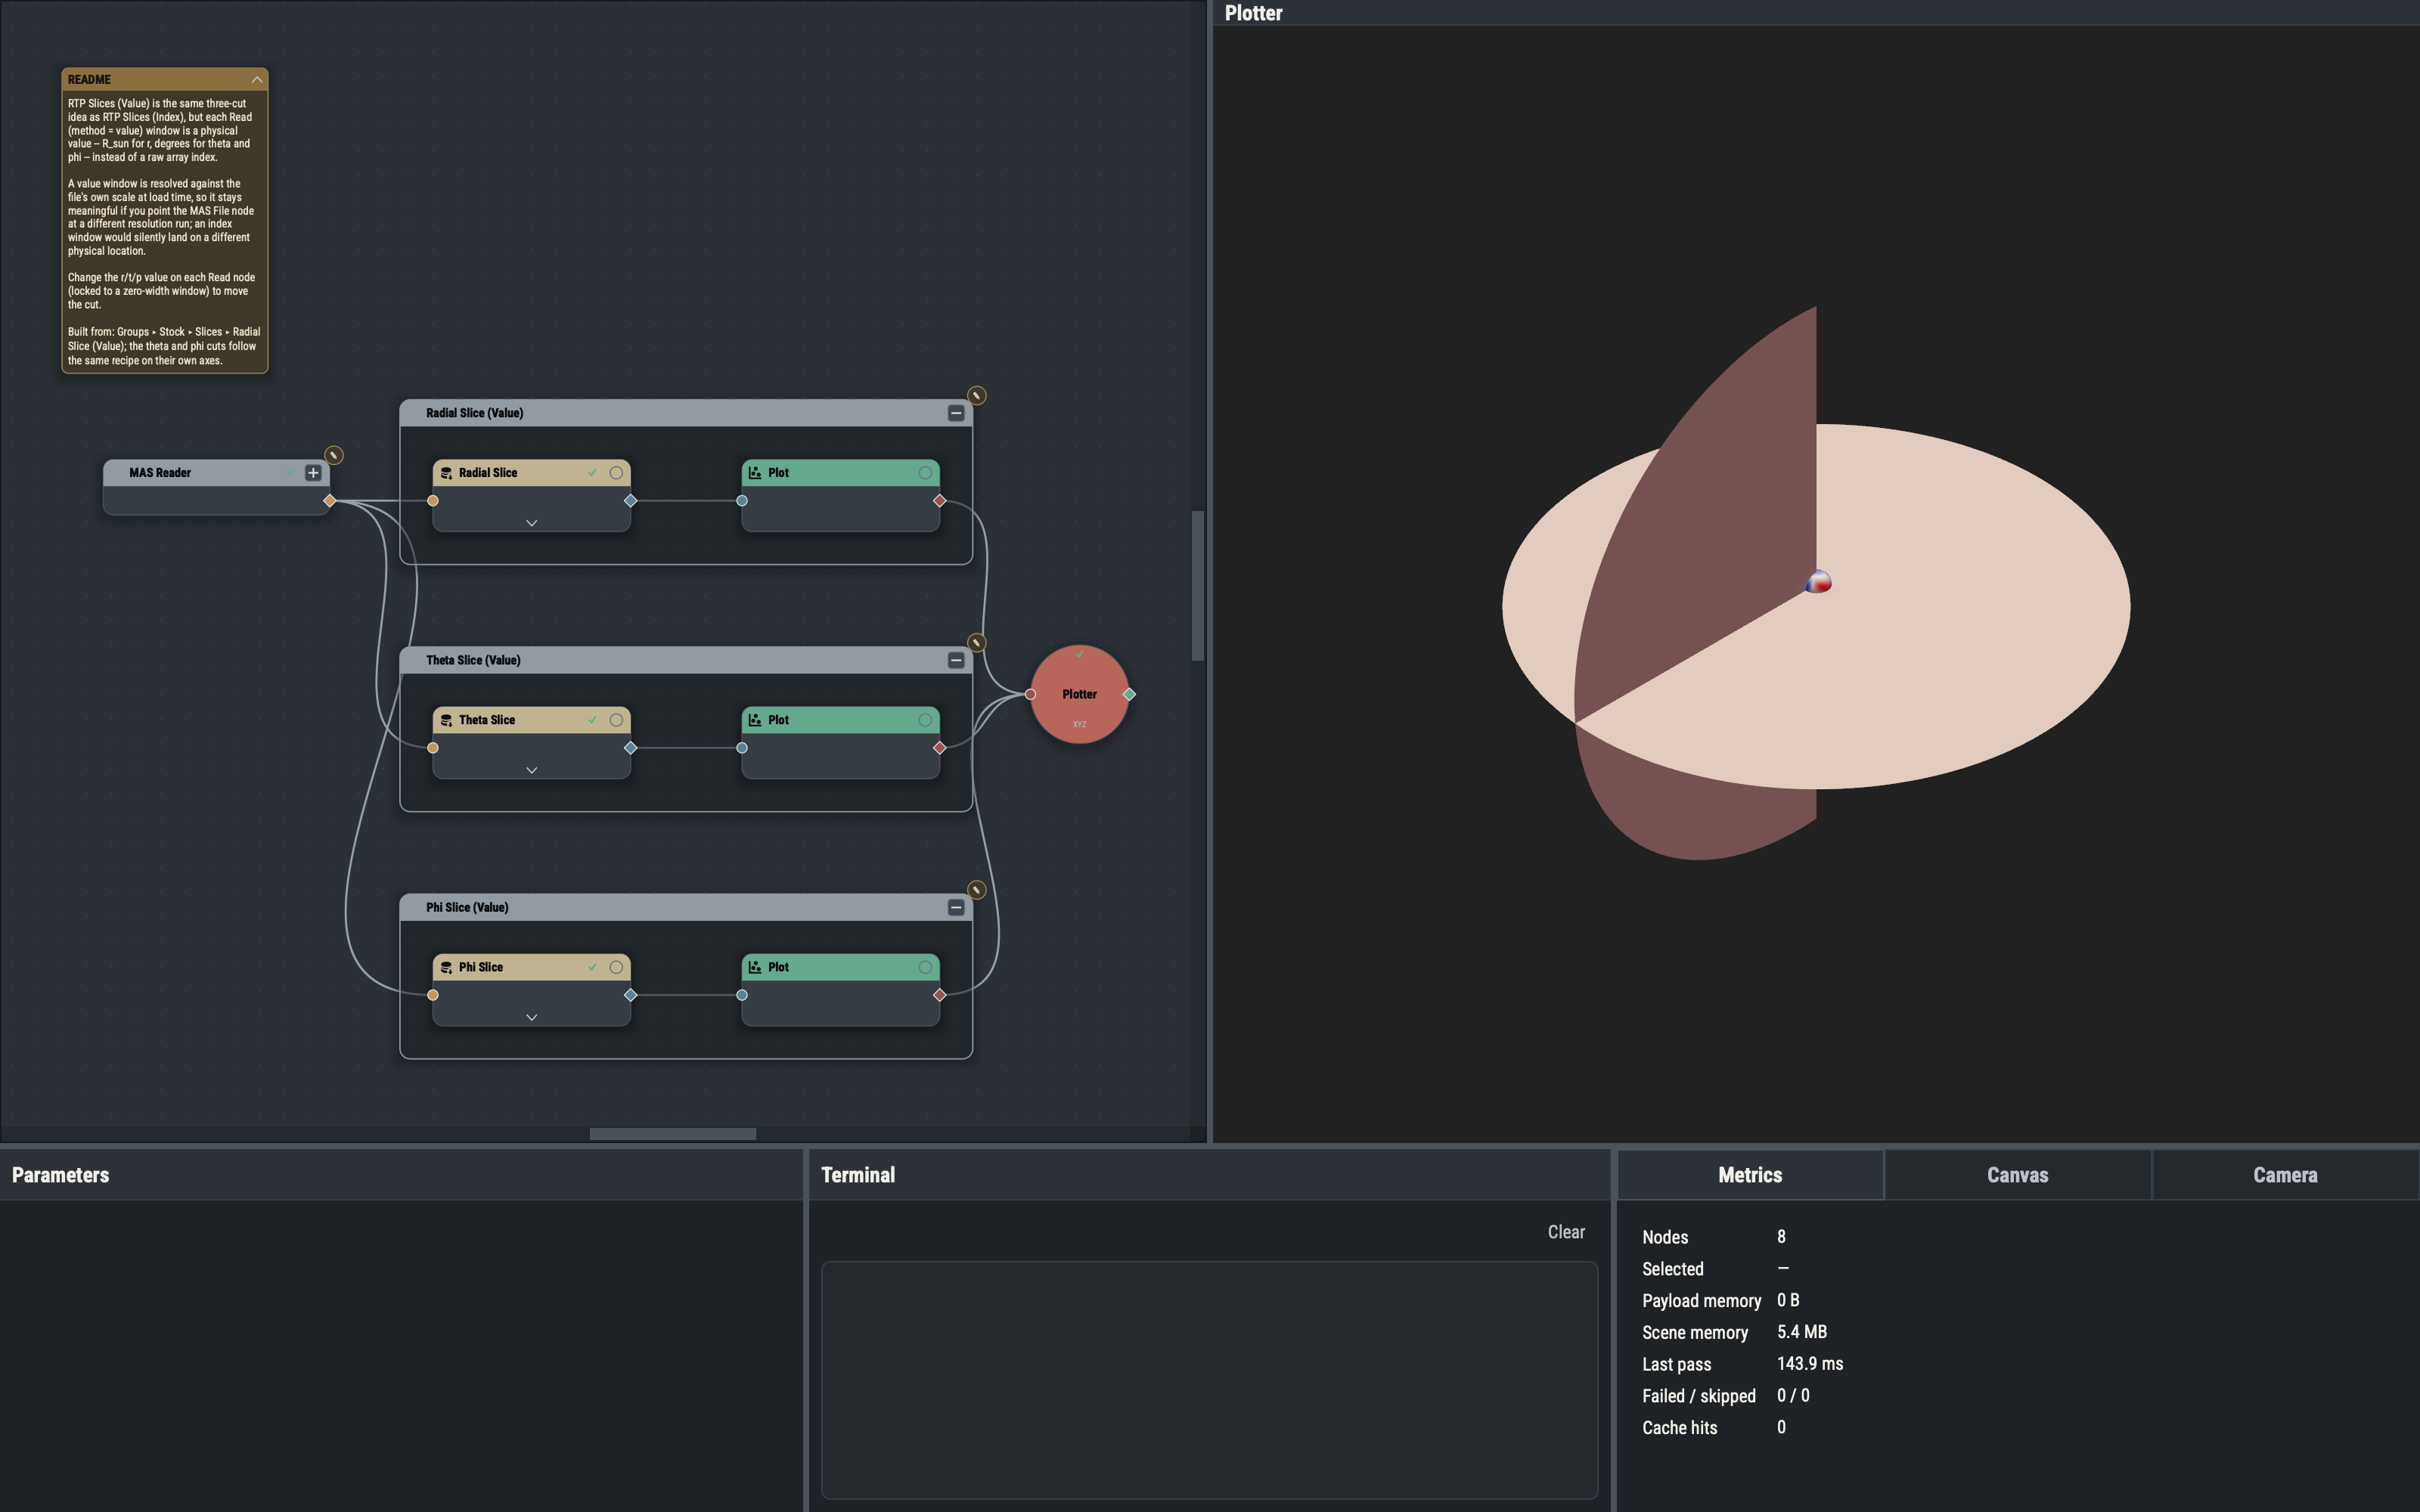
A node-graph front end for 3-D visualization of solar and MHD model output. Connect readers, slices, tracers and plots on a canvas and see the result in a live 3-D viewport.
Download
Installers for macOS (Apple silicon and Intel) and Linux (x86_64 and aarch64).
Concepts
Nodes, families, ports, kinds, groups, sessions and panes: the vocabulary in one page.
Nodes
Searchable reference for all 218 node types, each drawn as it appears on the canvas.
Templates
54 ready-made sessions and 31 reusable groups, with graph previews.
Guide
The user manual: every menu, pane, setting, shortcut and command-line flag.
Tutorial
Sixteen examples in four sets, from a single sphere to spacecraft, null points, exported fields and animations.