 PVA
Null Point Spine Tracing
Complex Analysis · 15 nodes · session (.pyv)
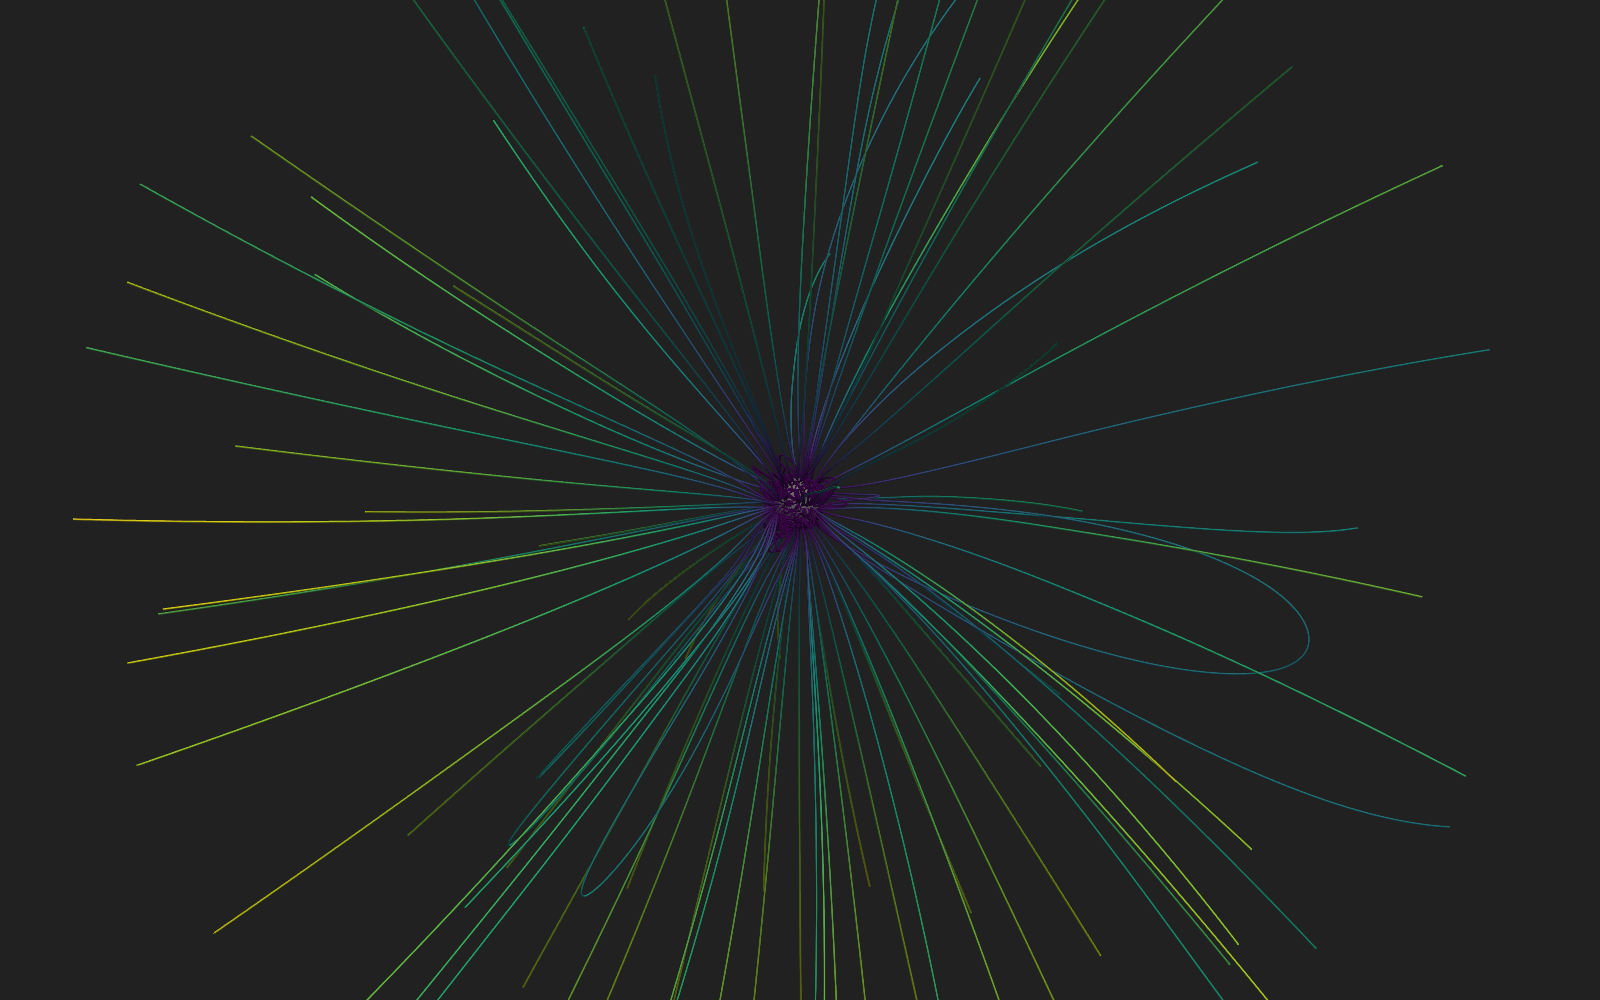
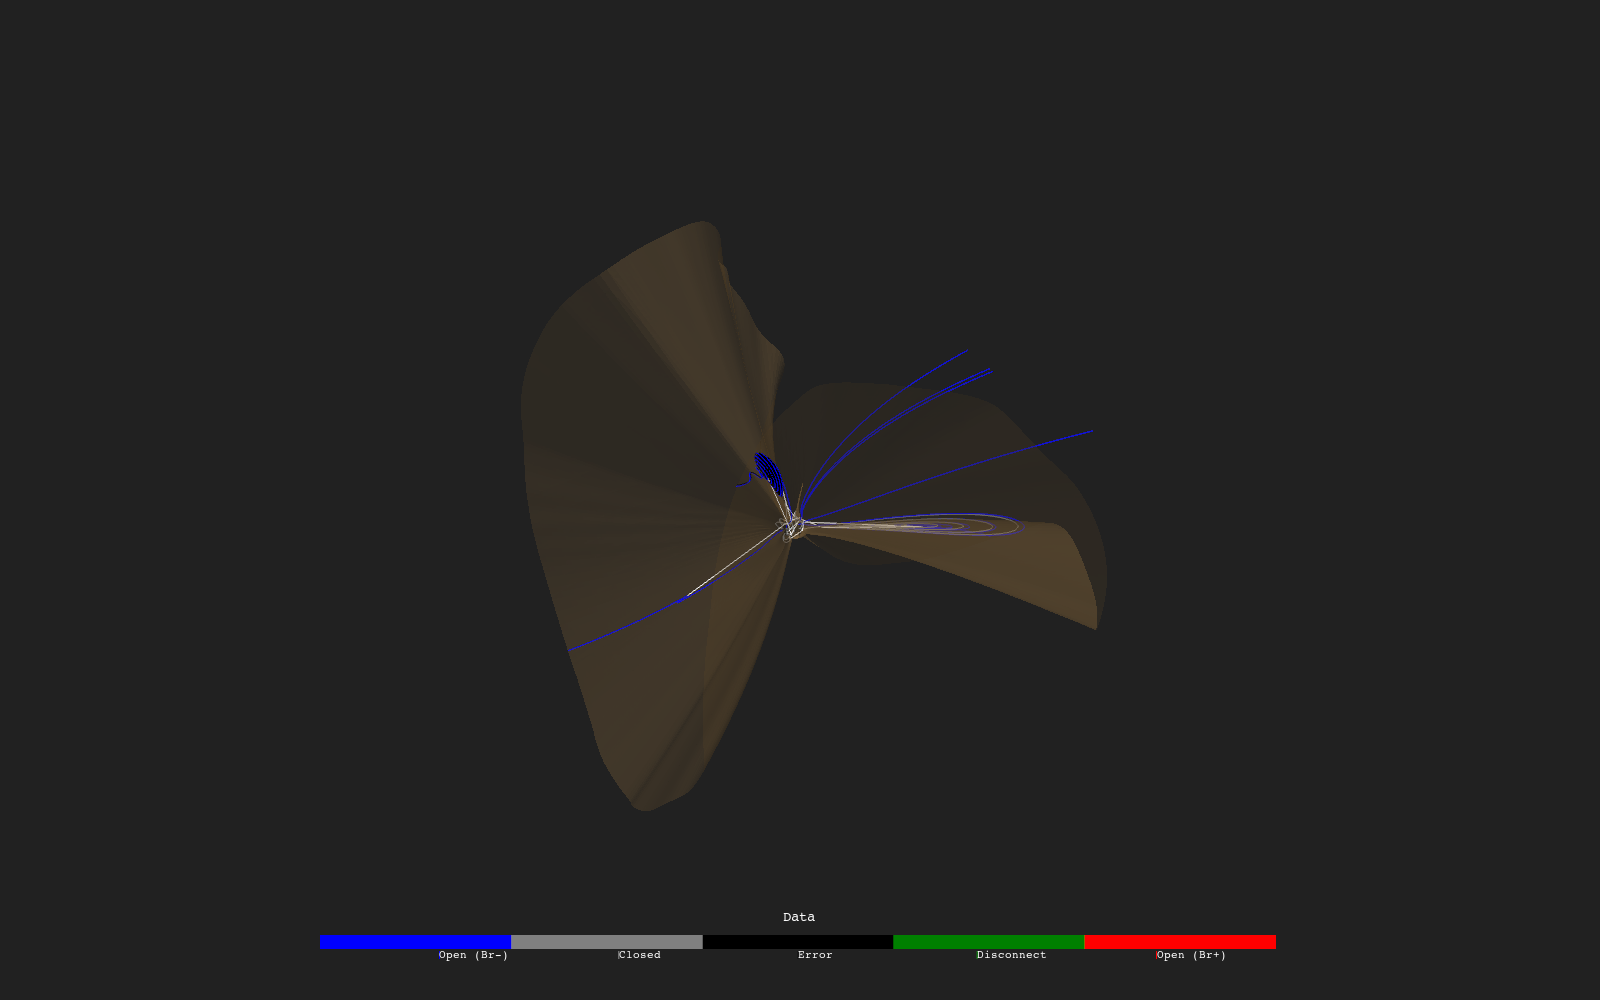
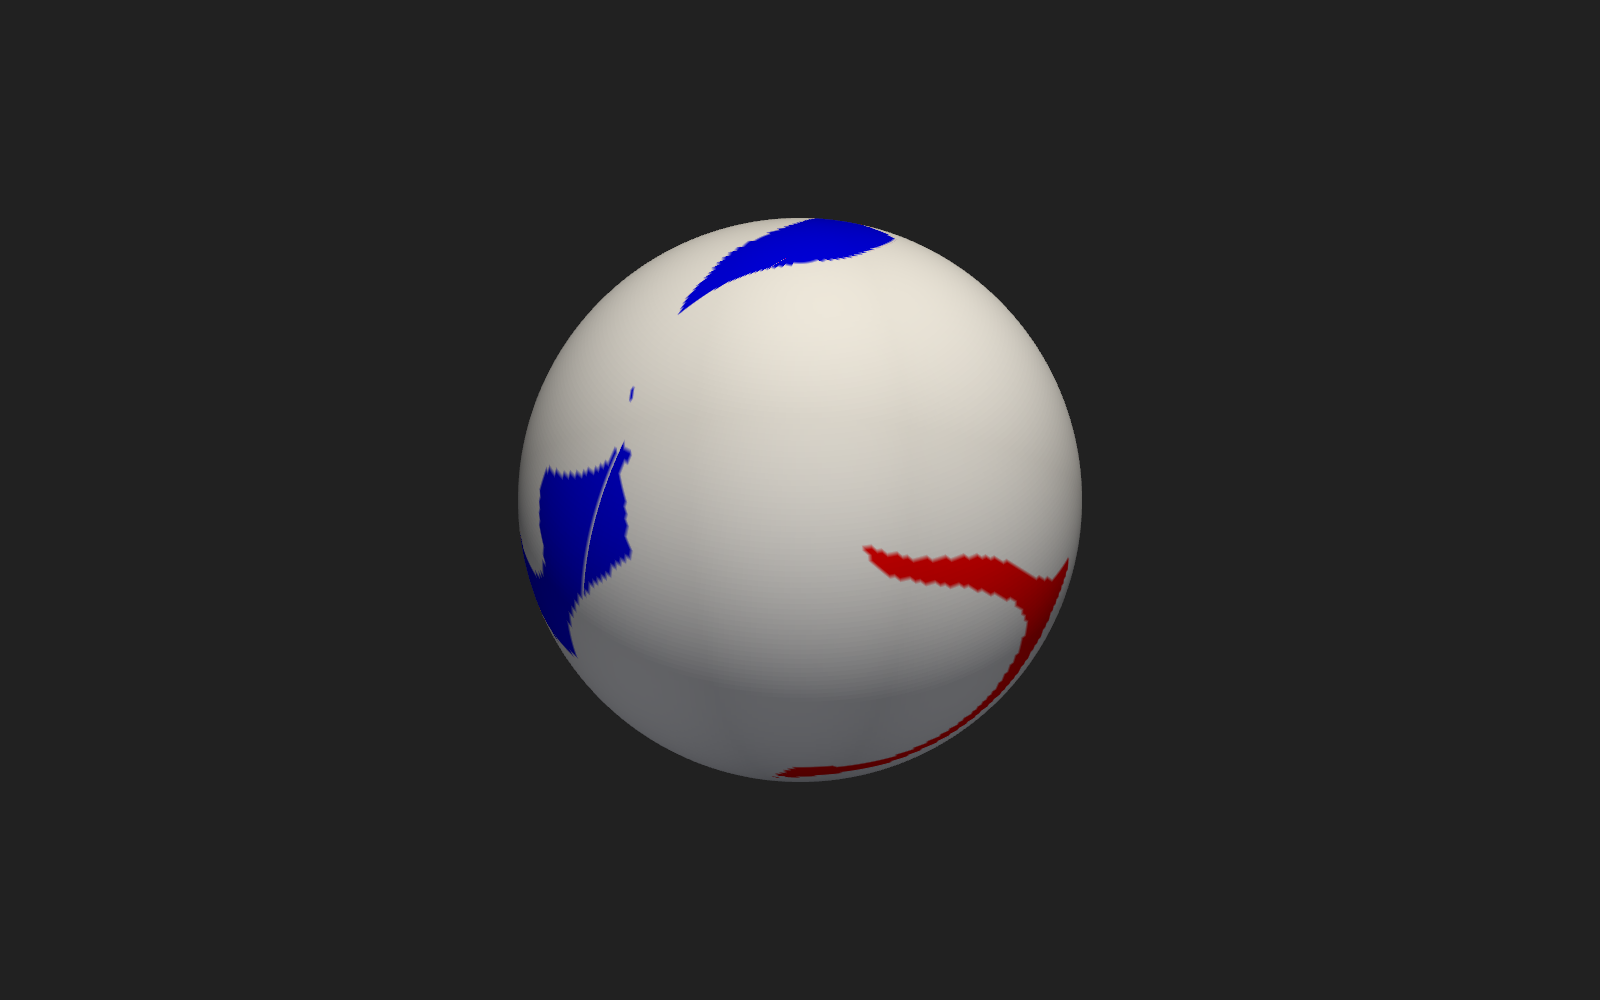
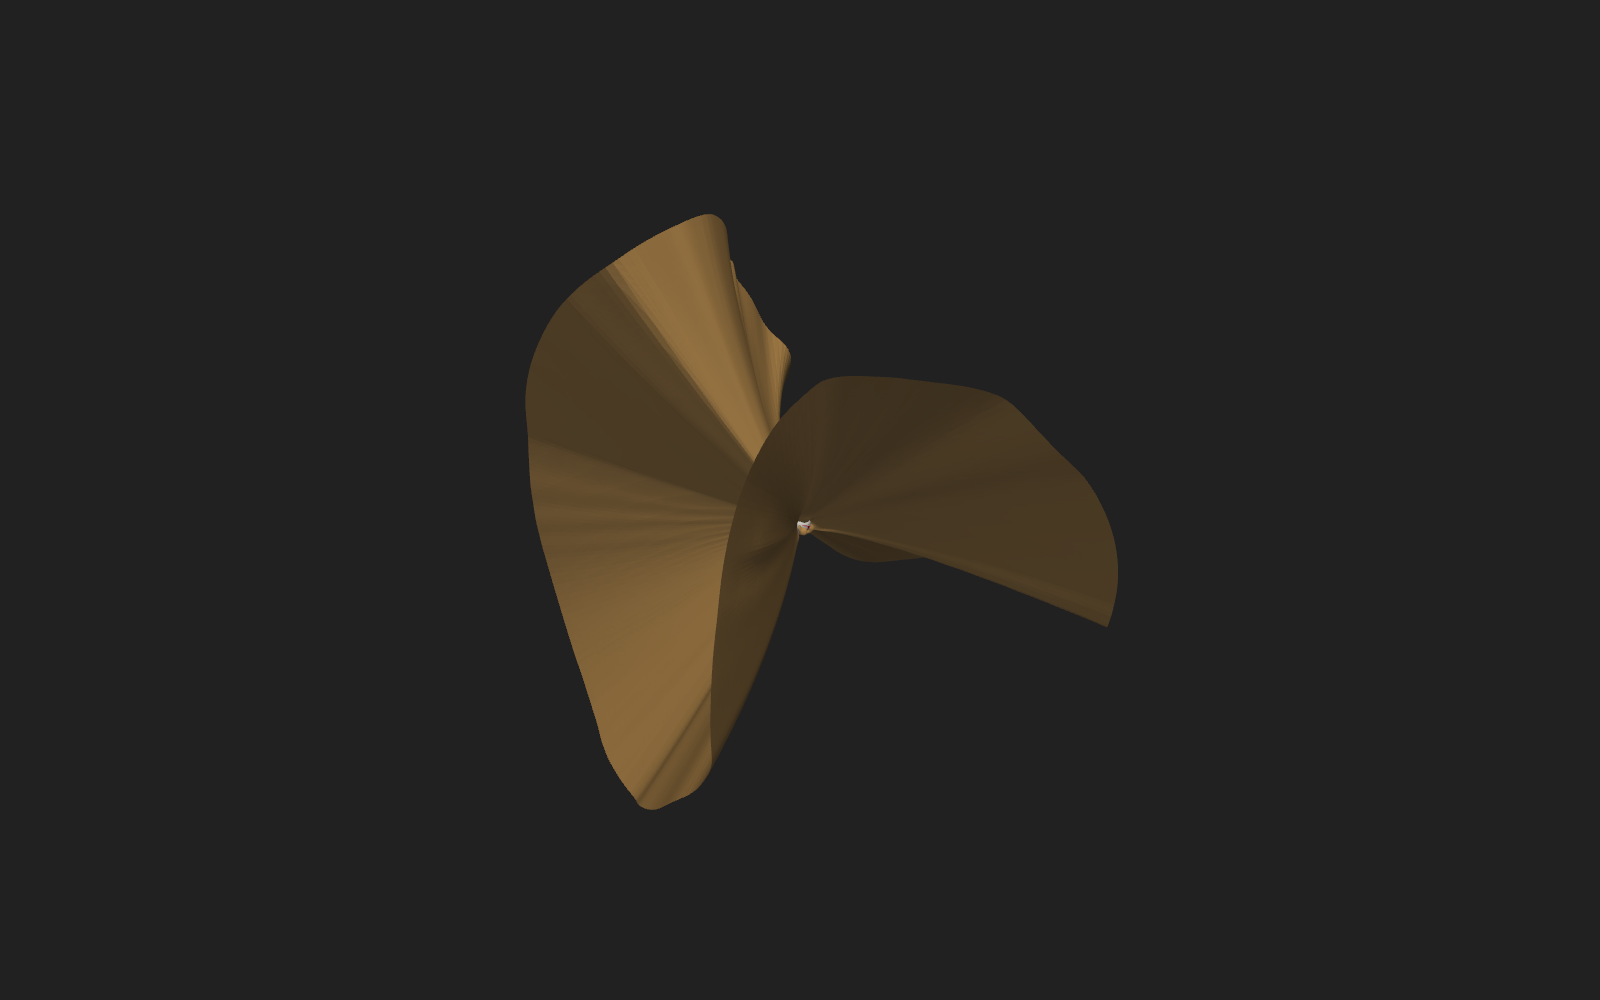
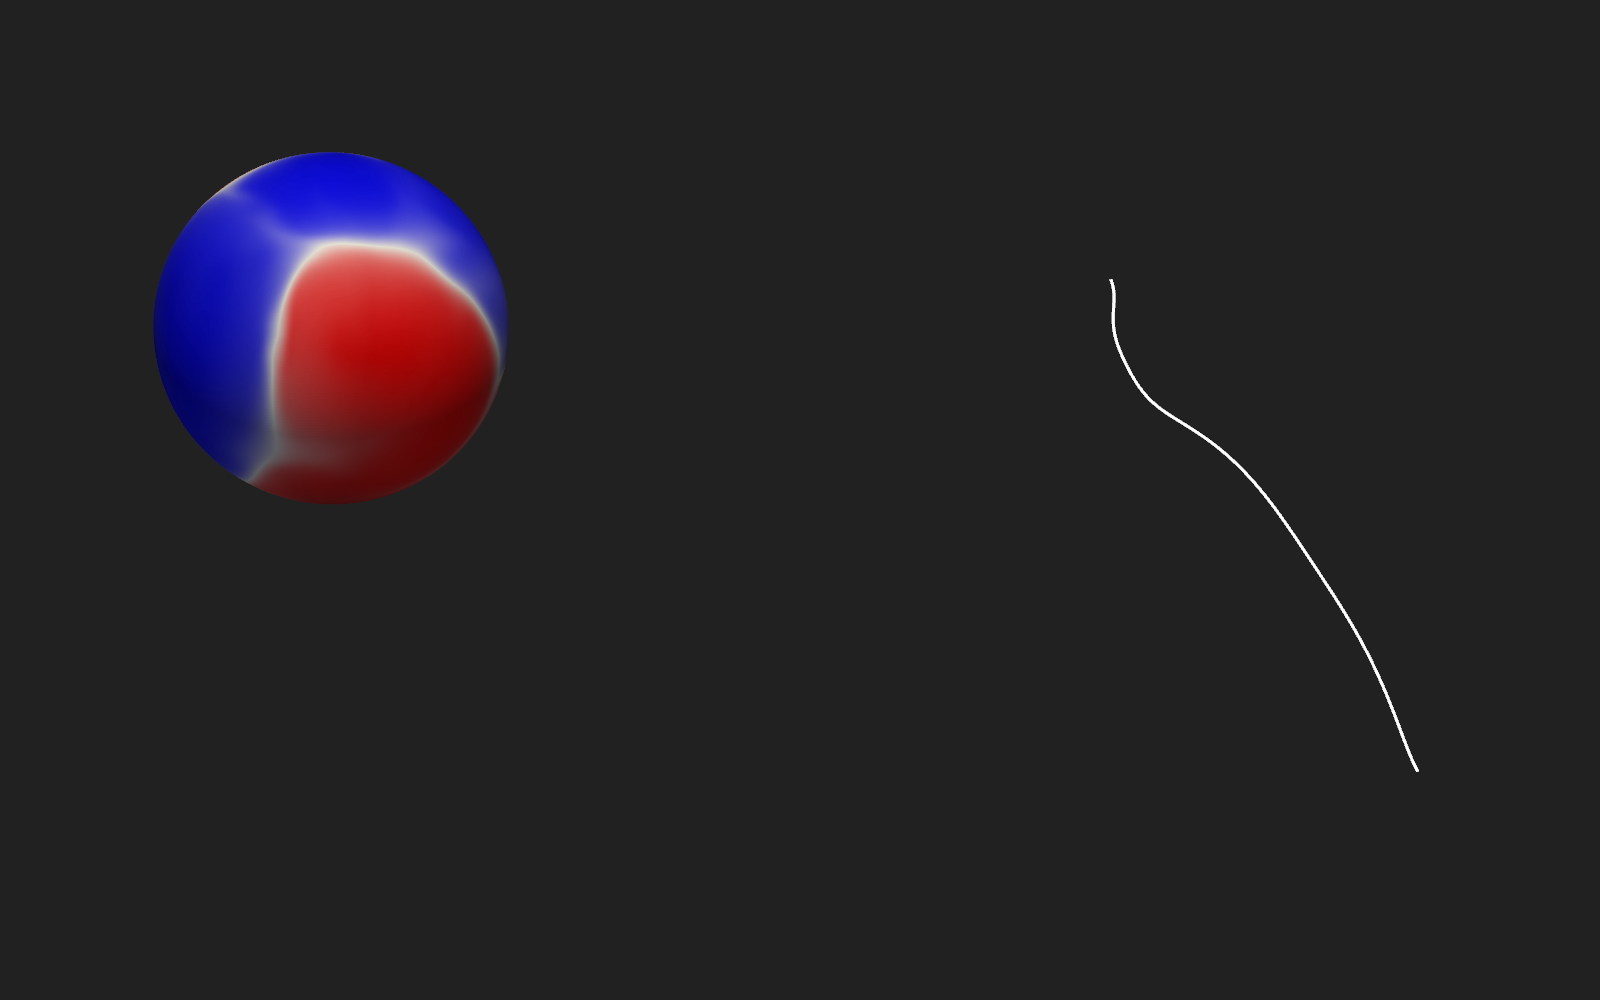
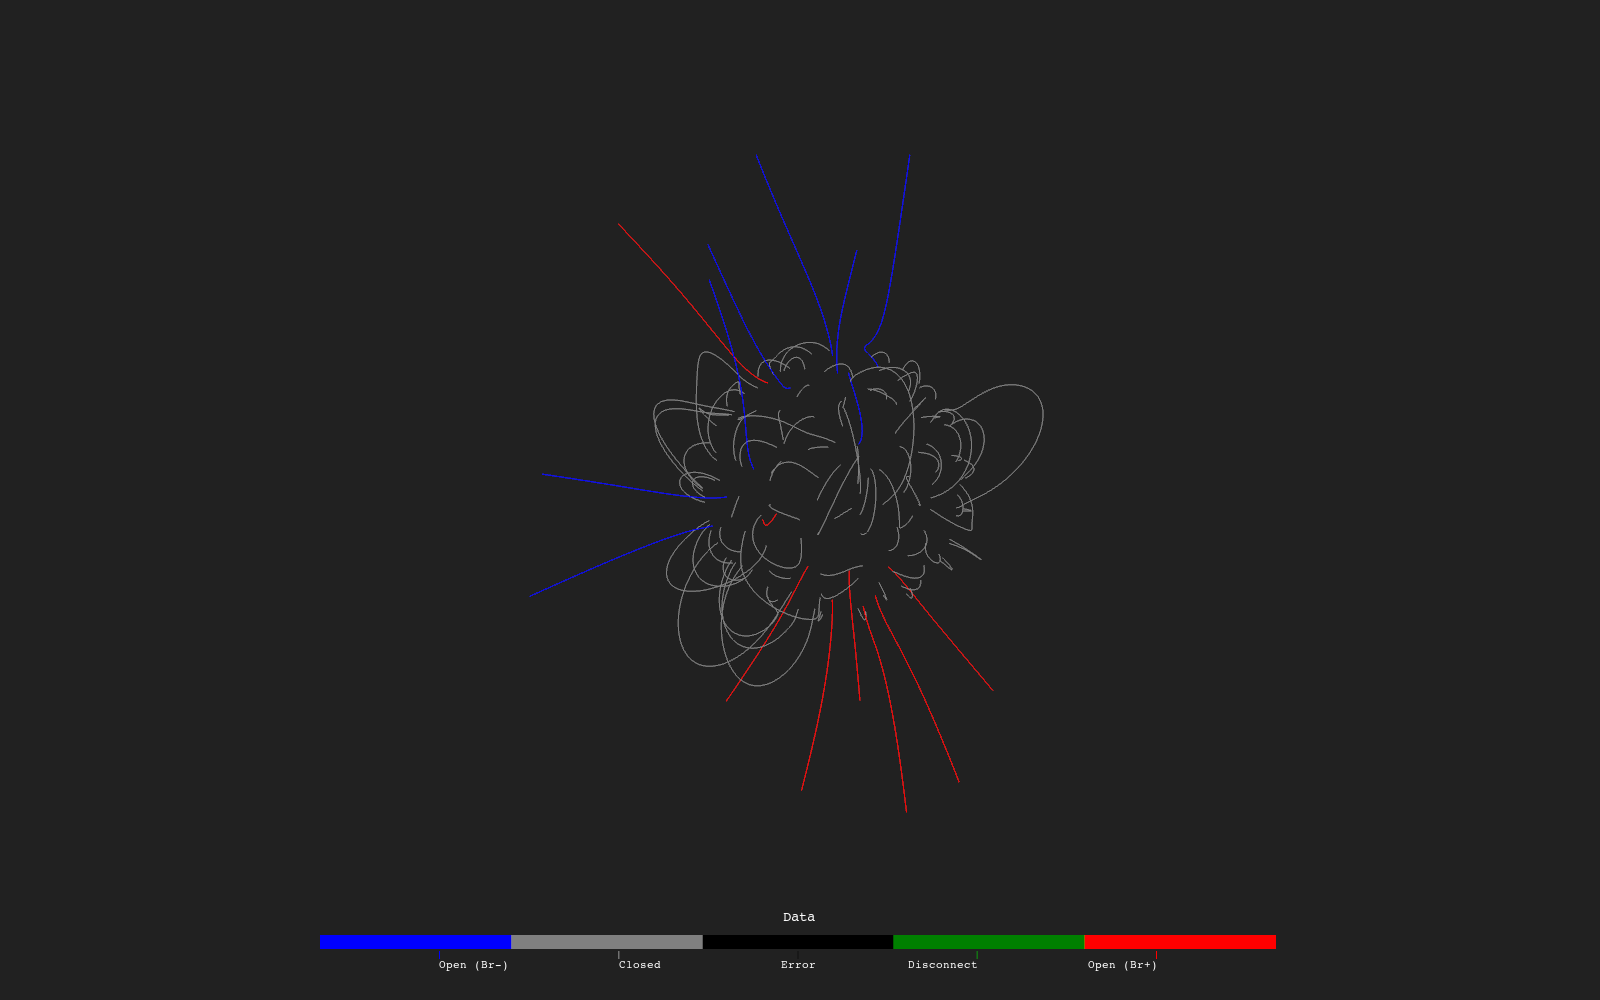
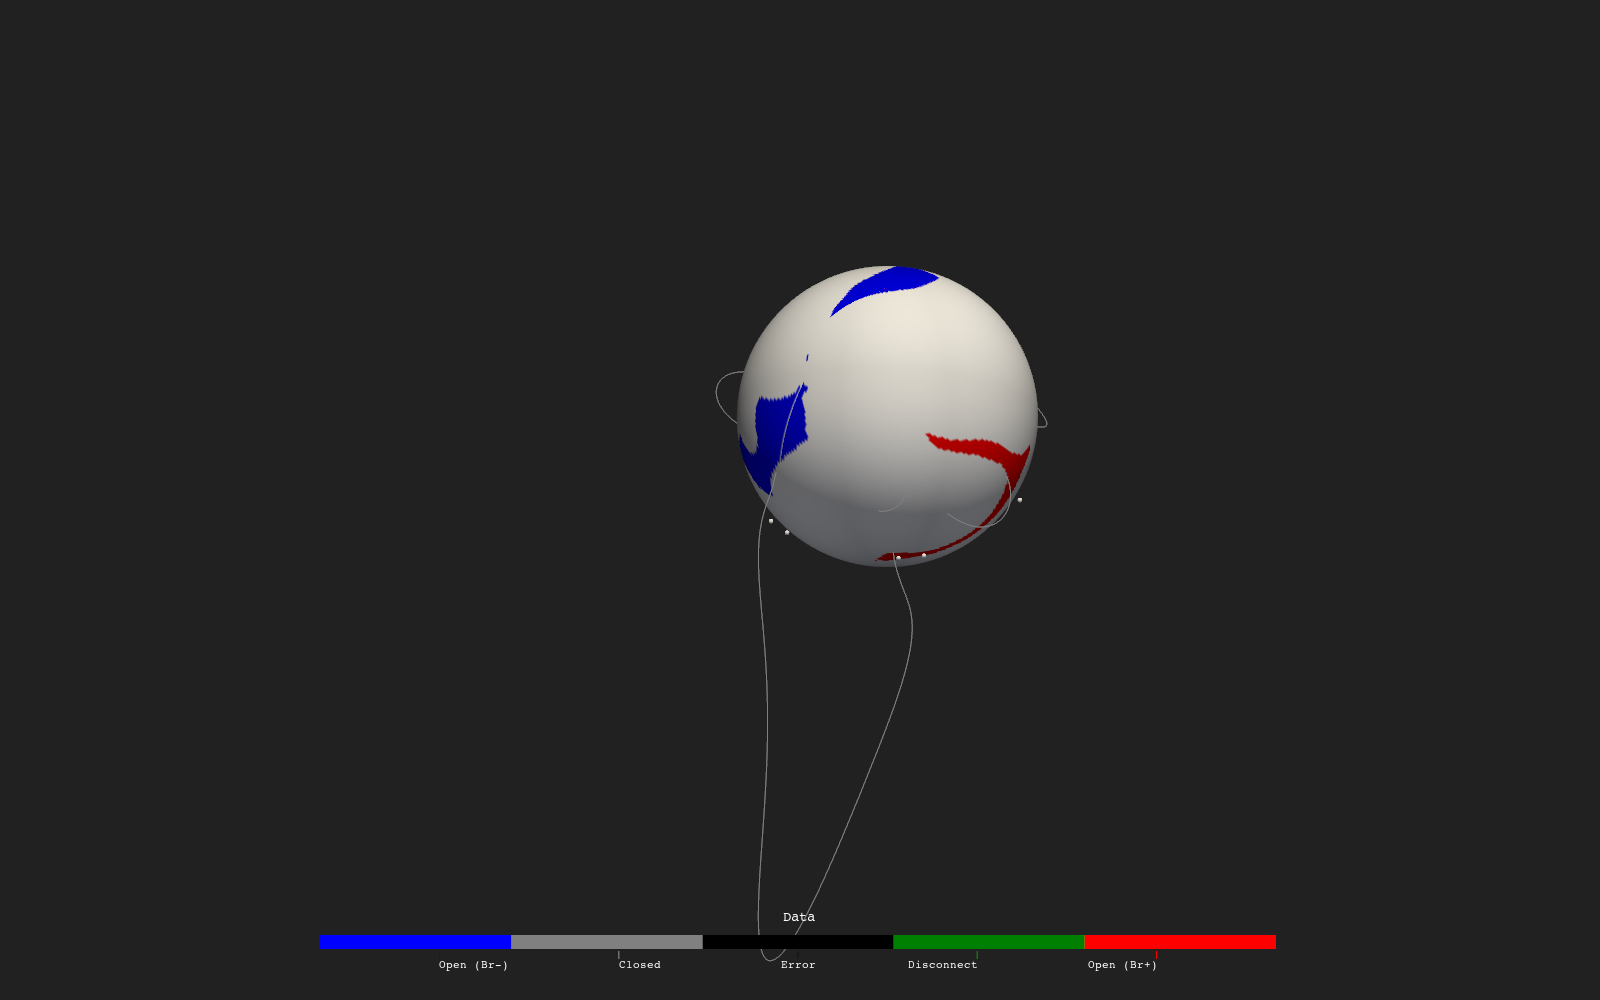
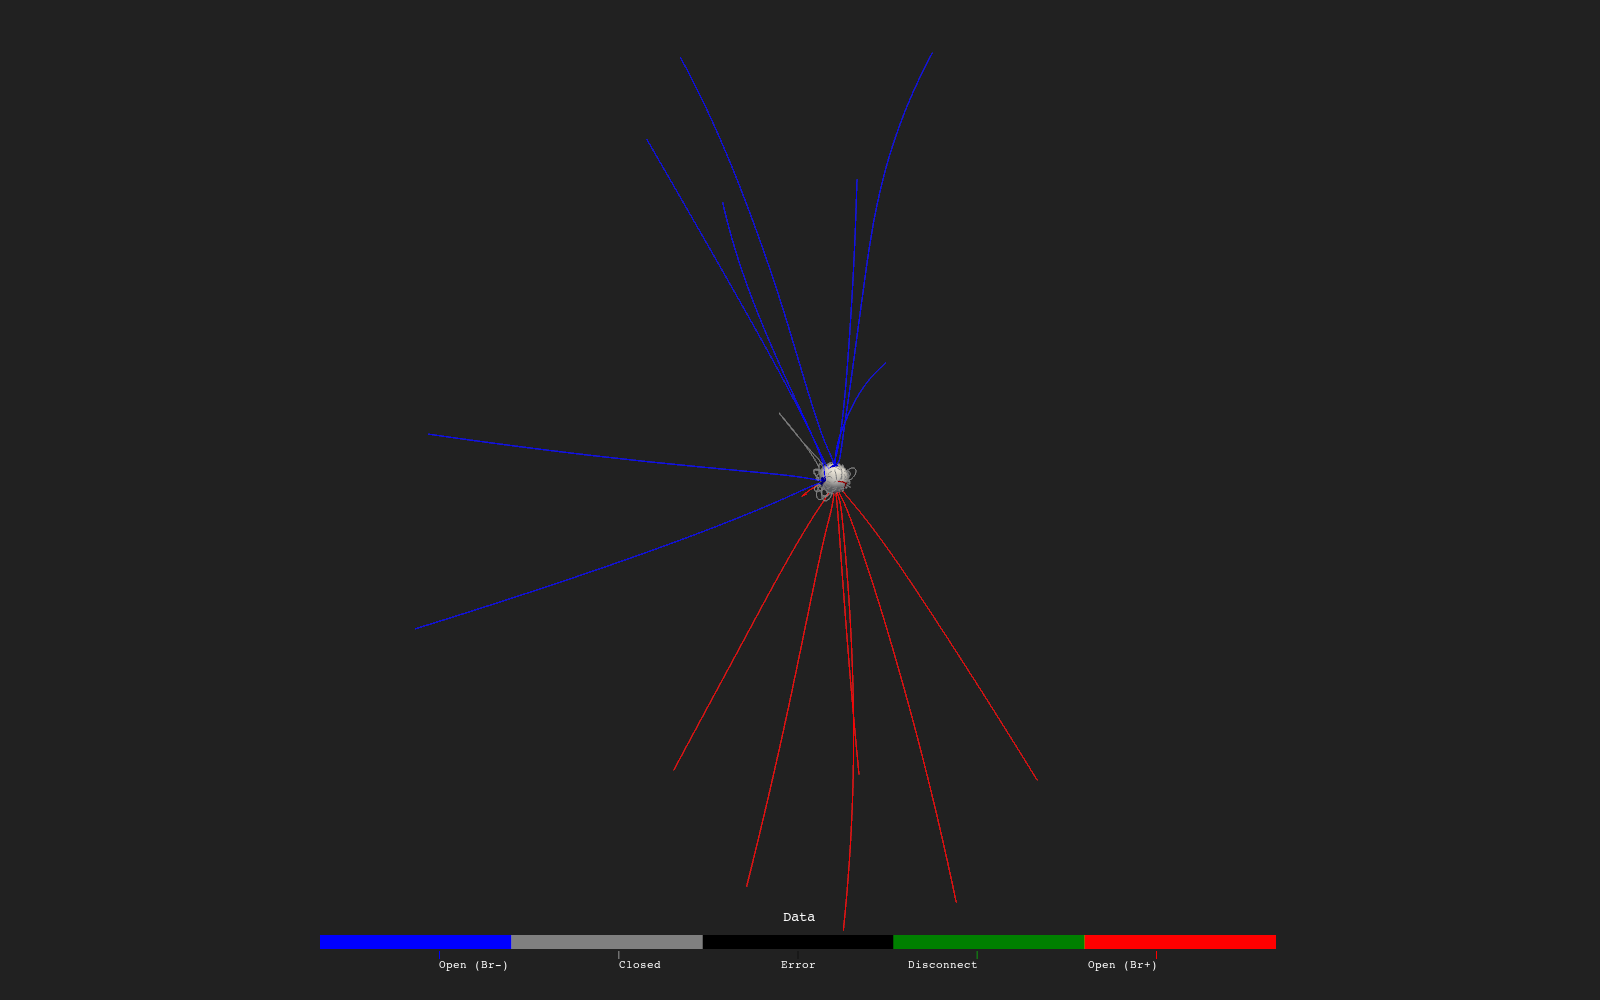
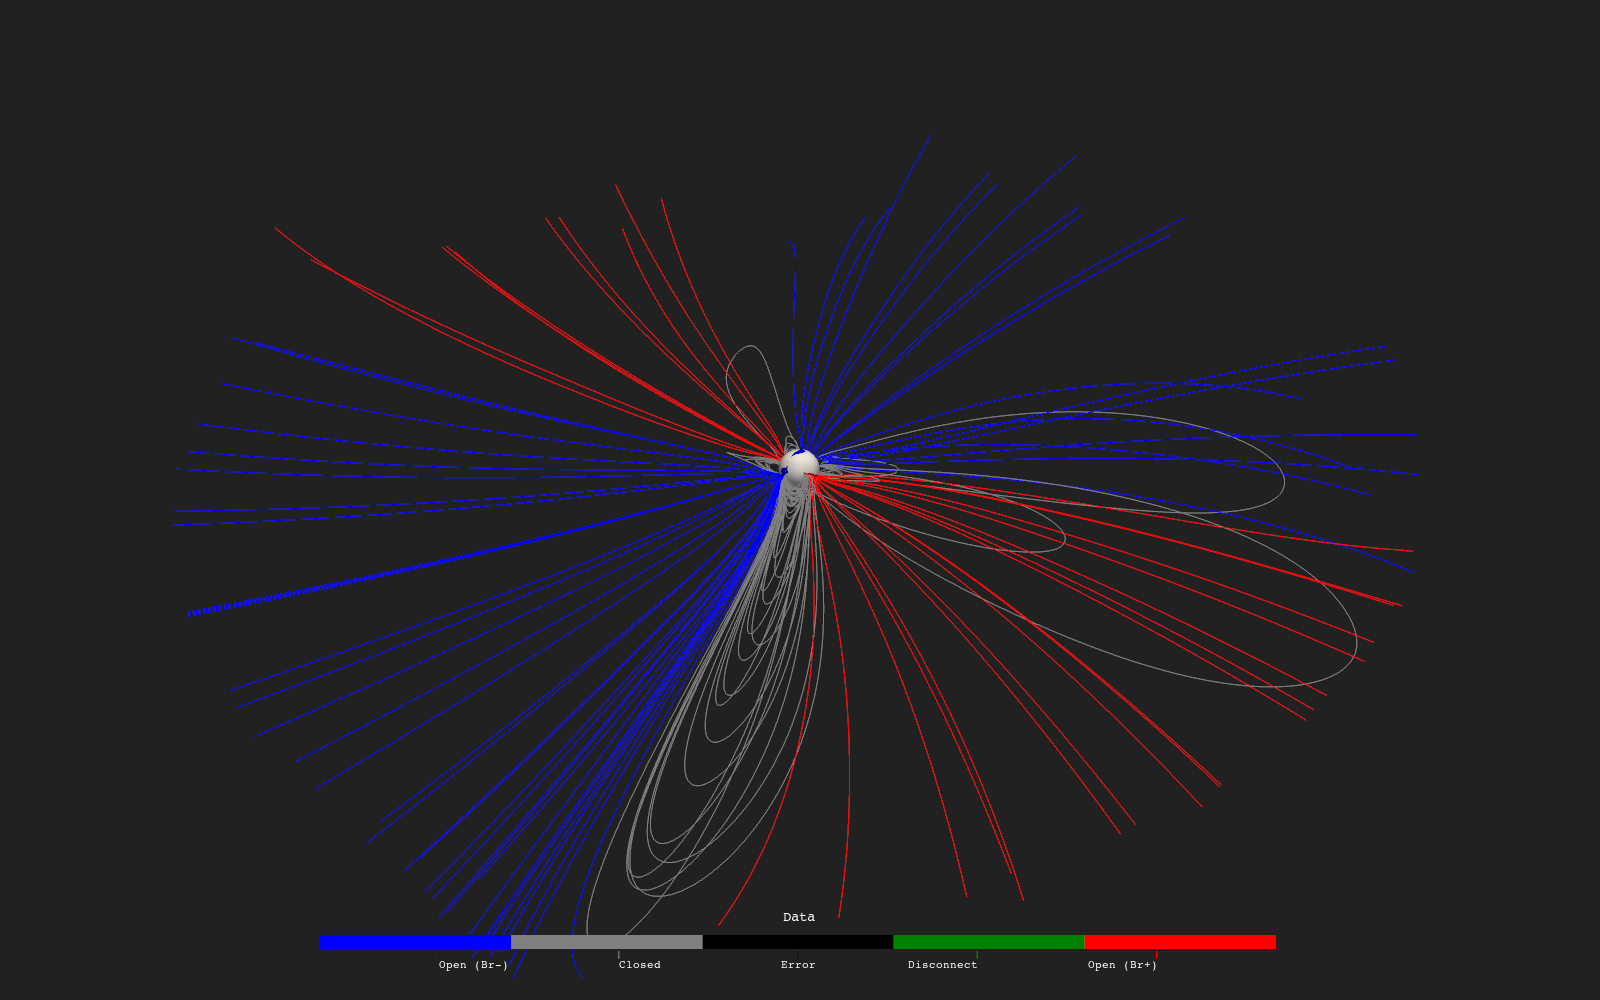
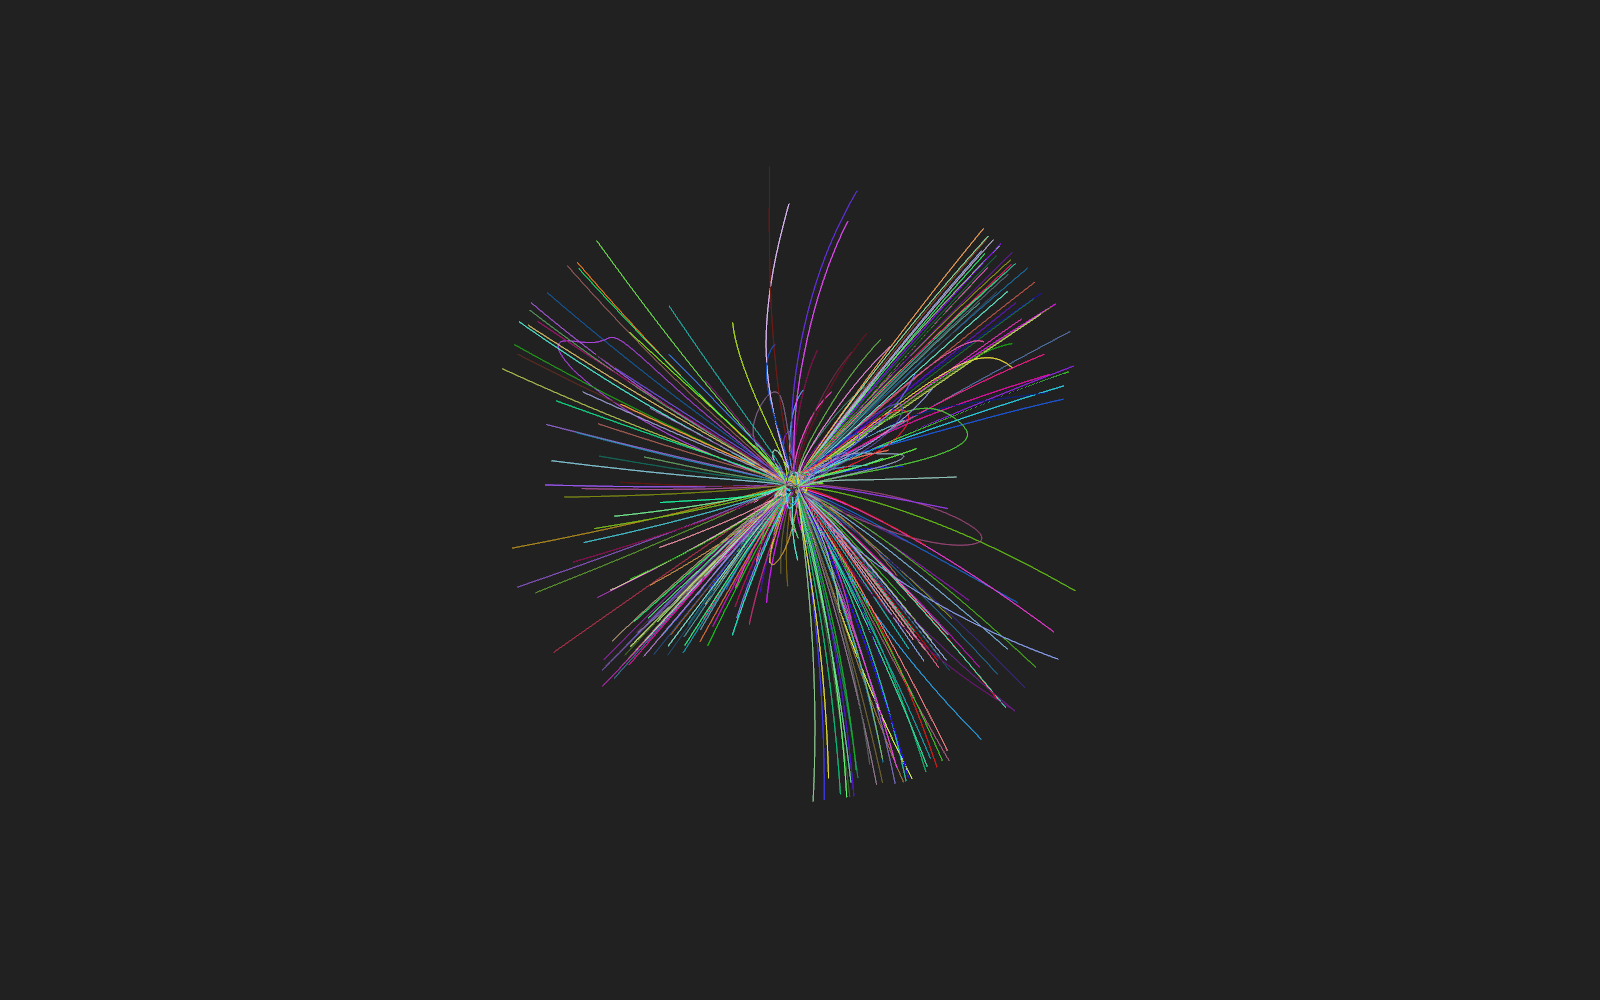
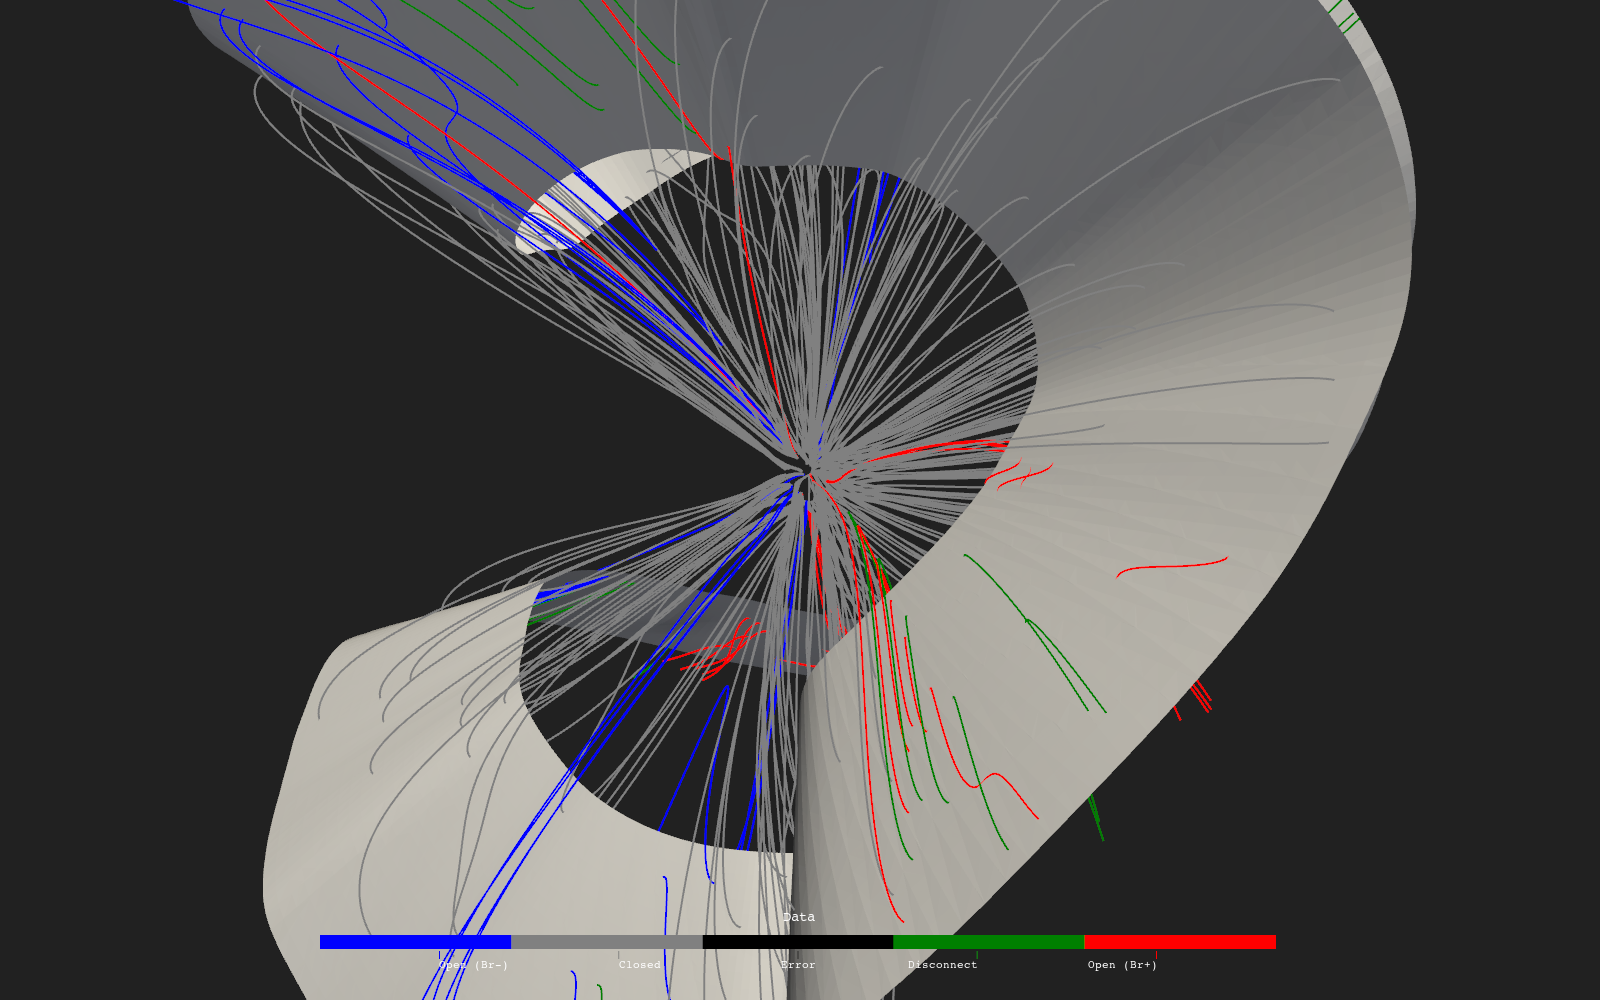
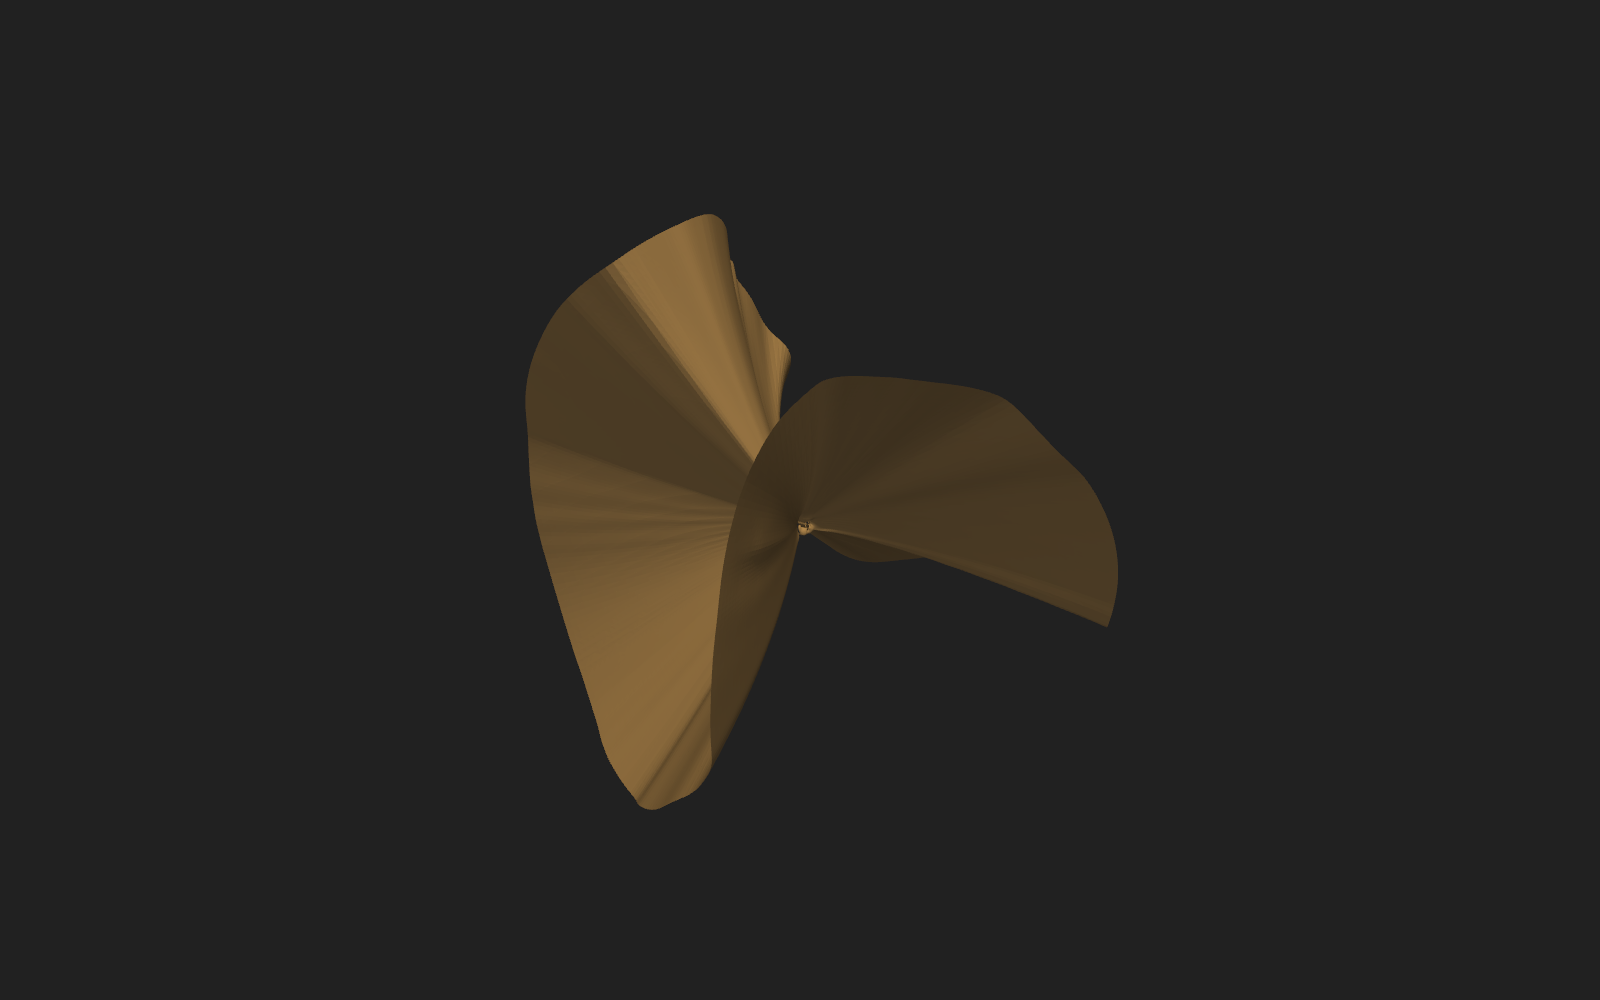
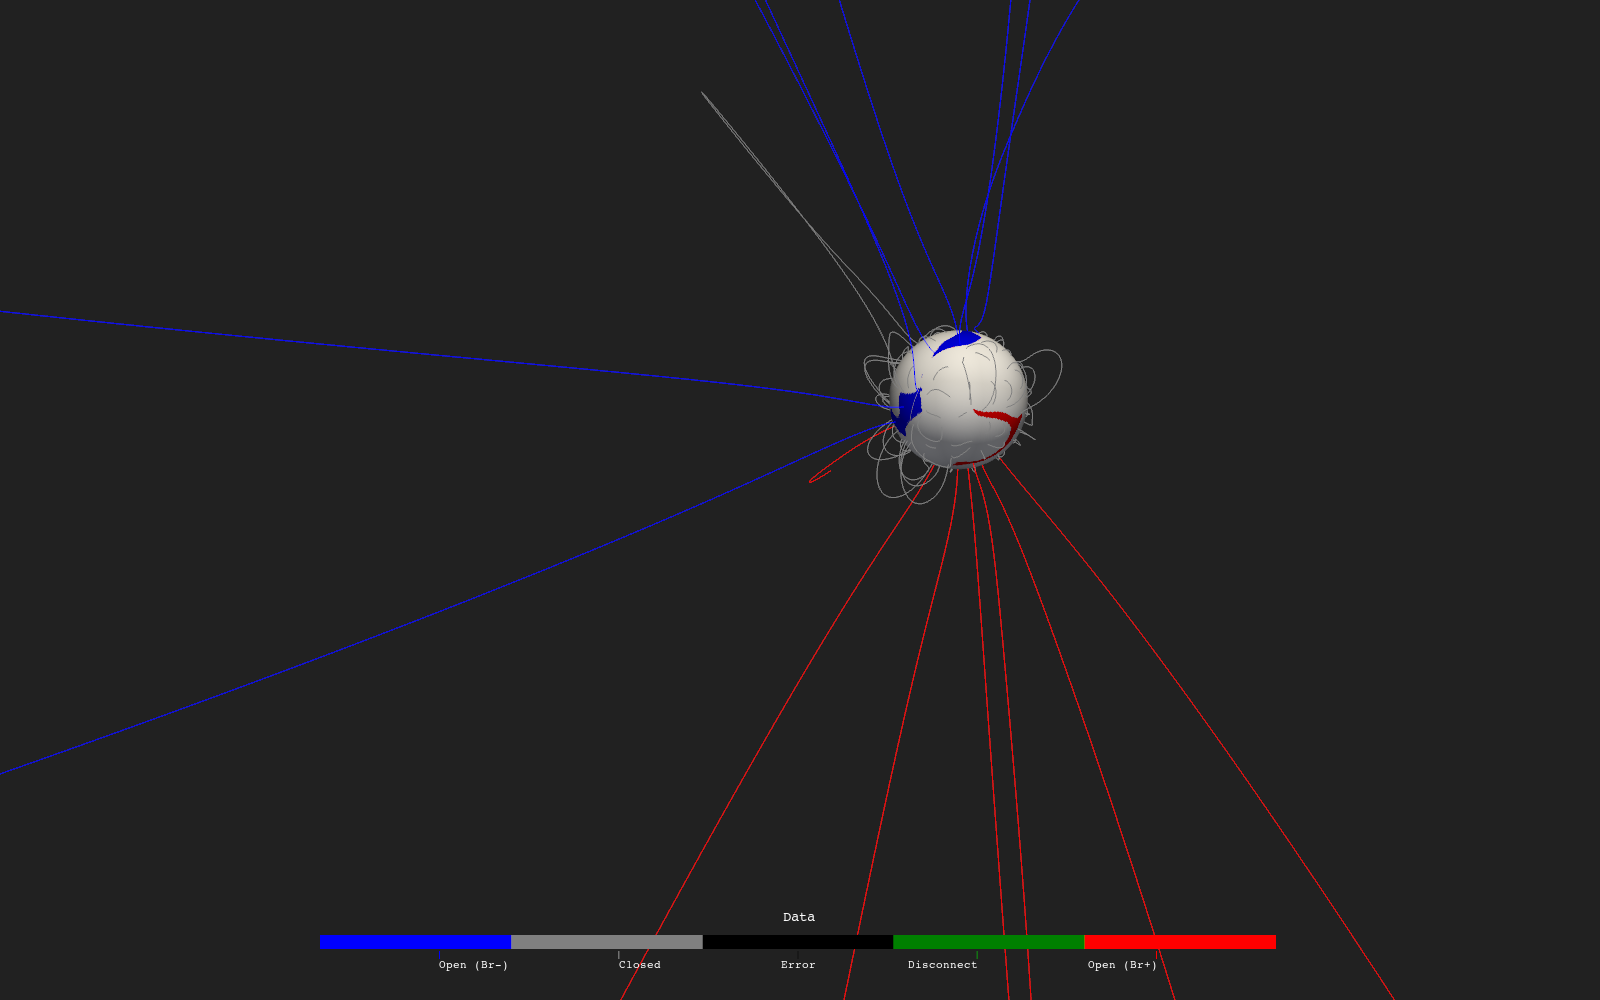
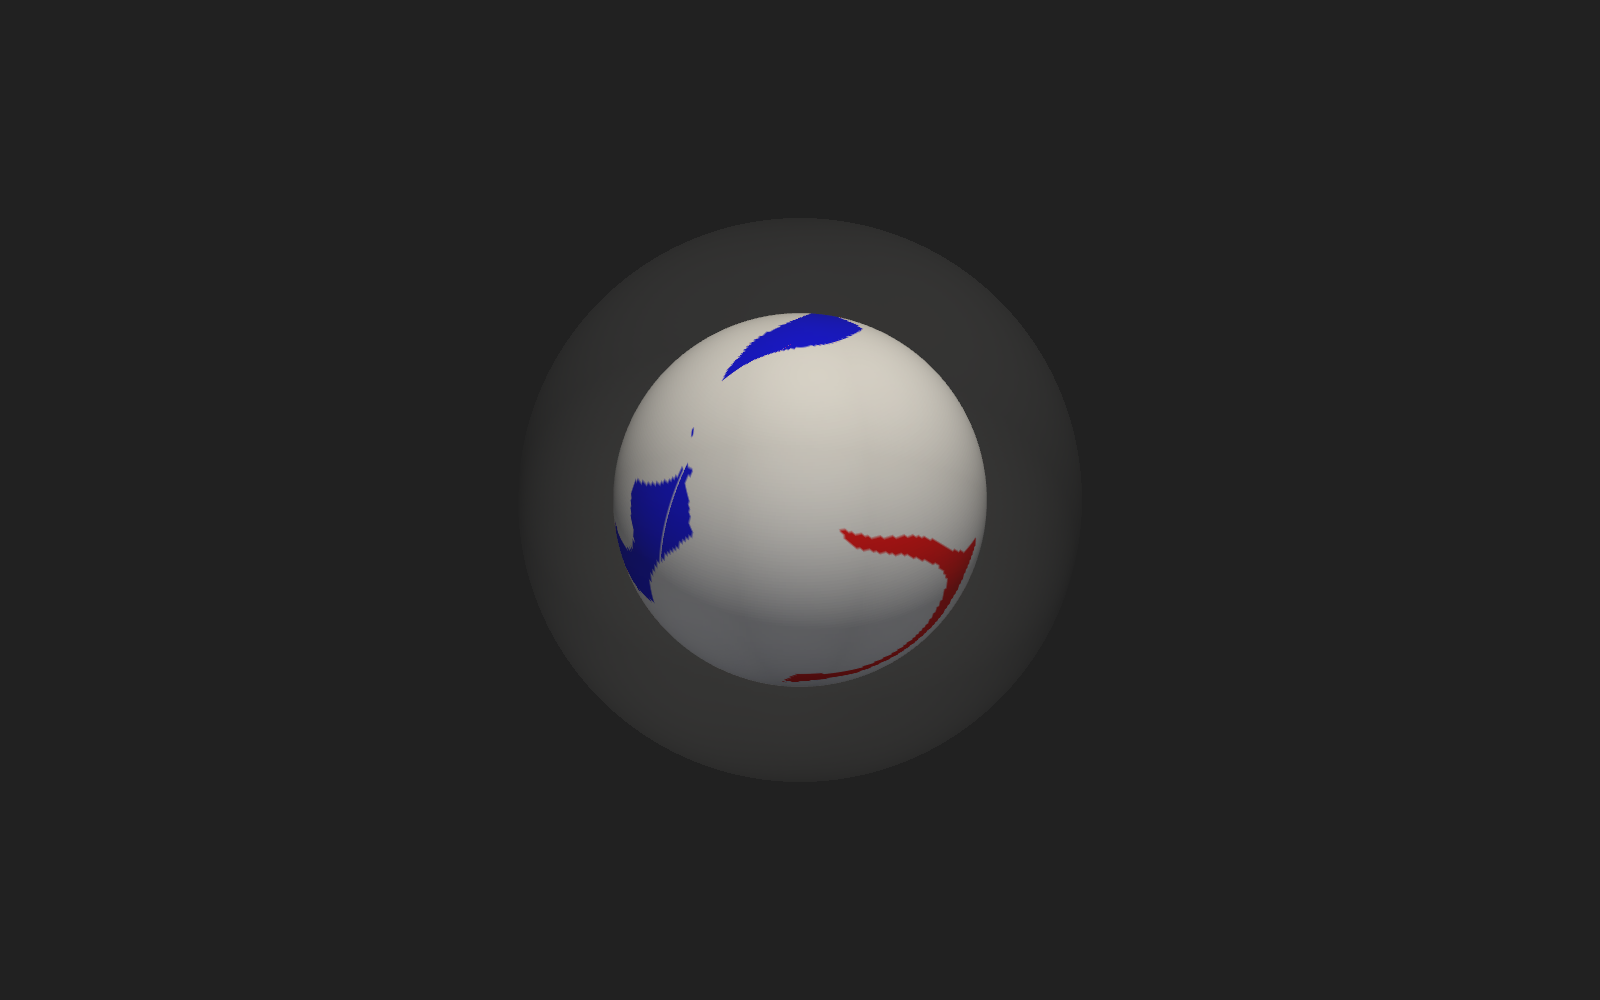
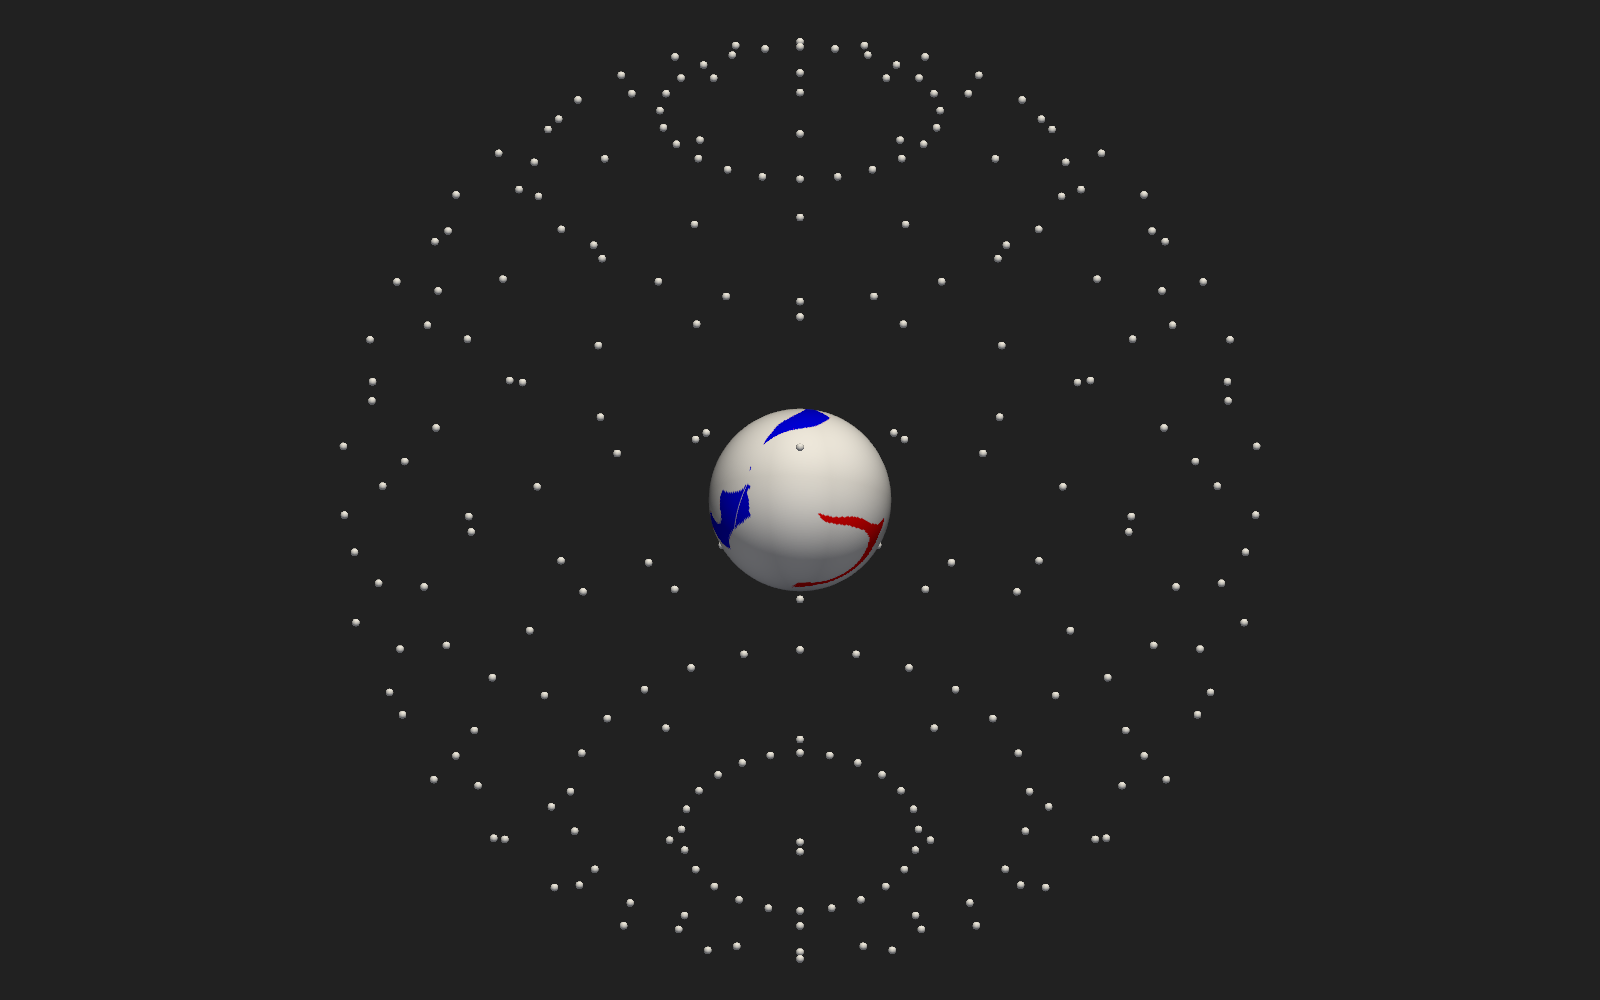
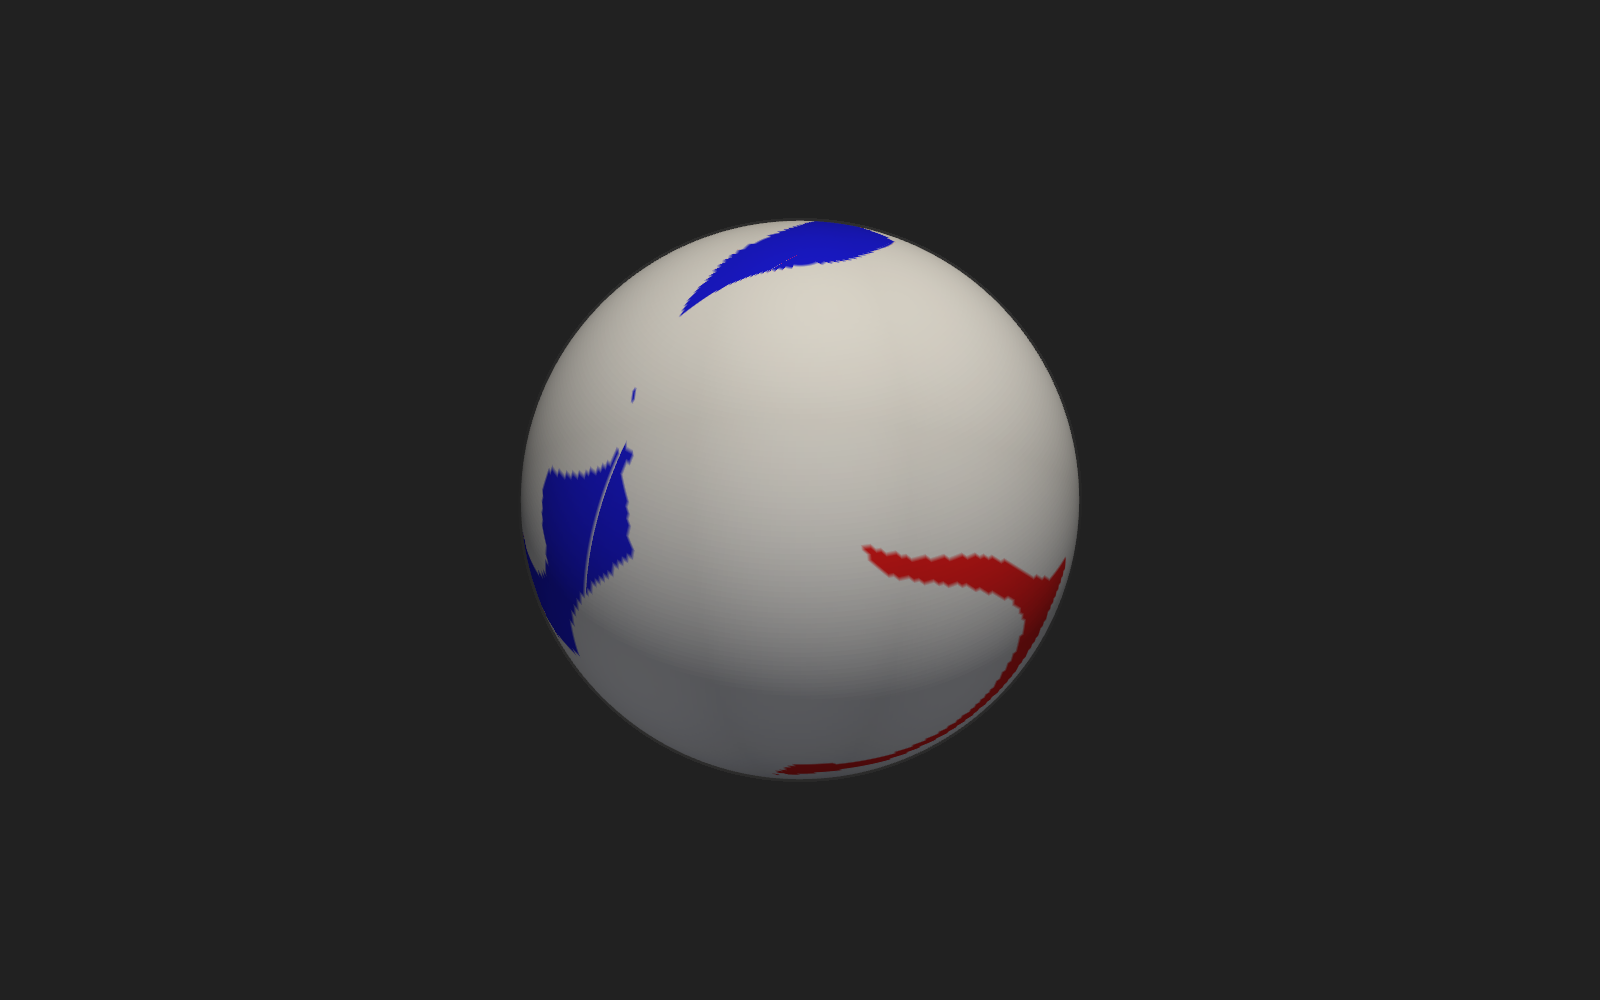
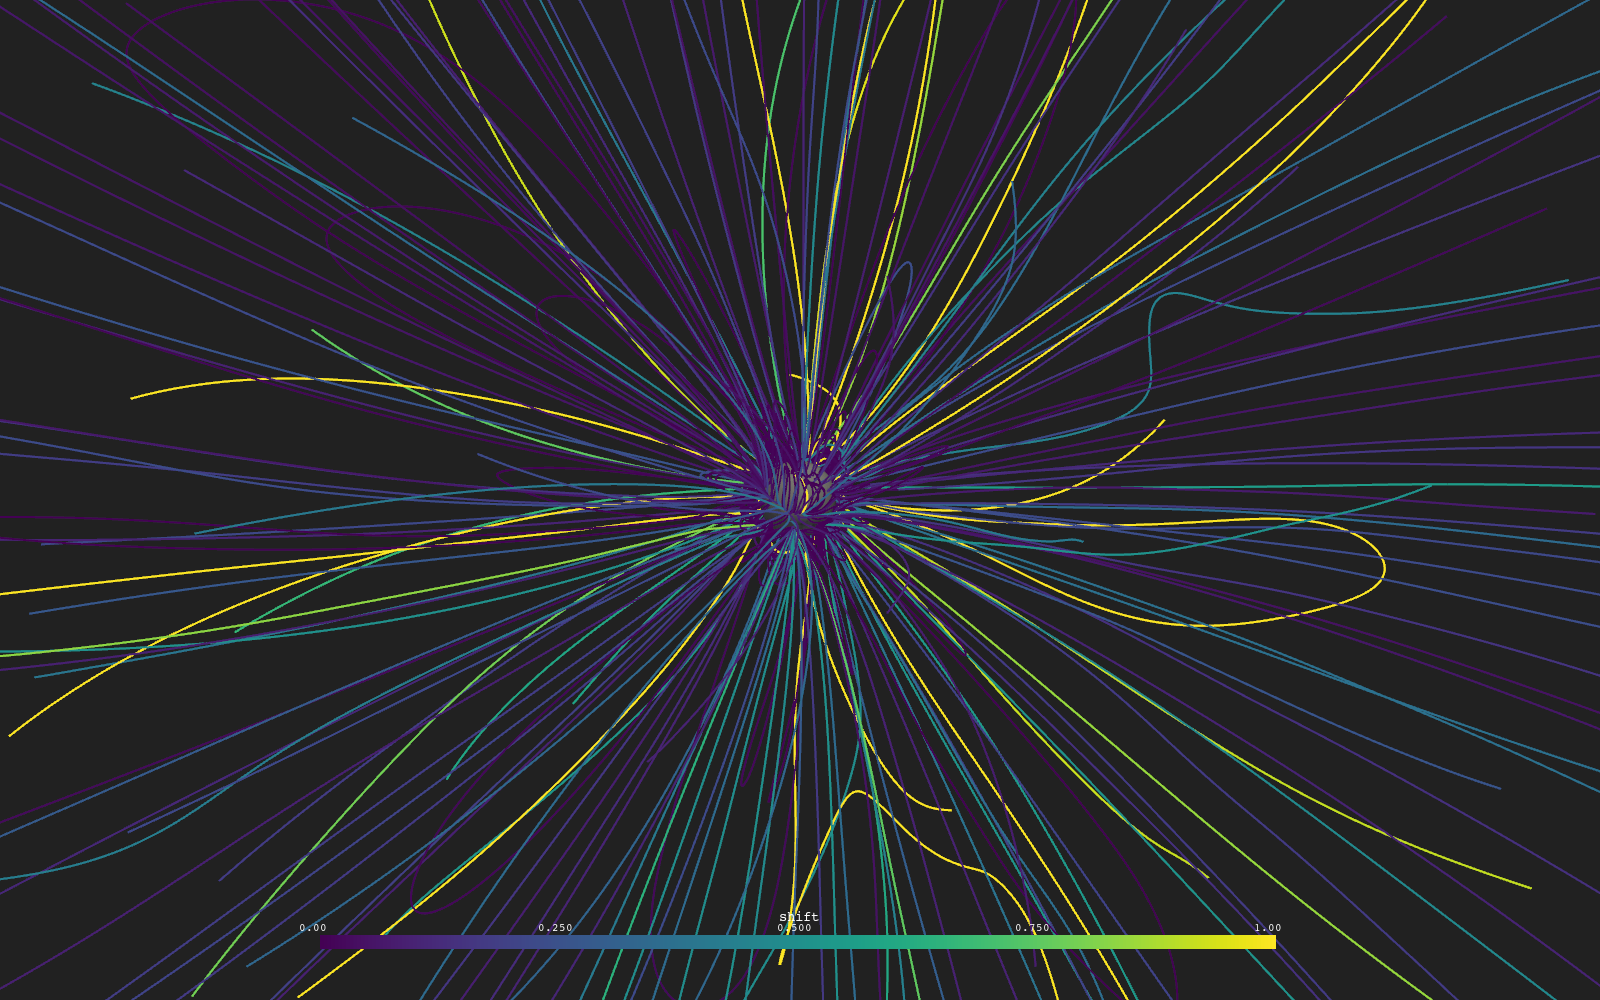
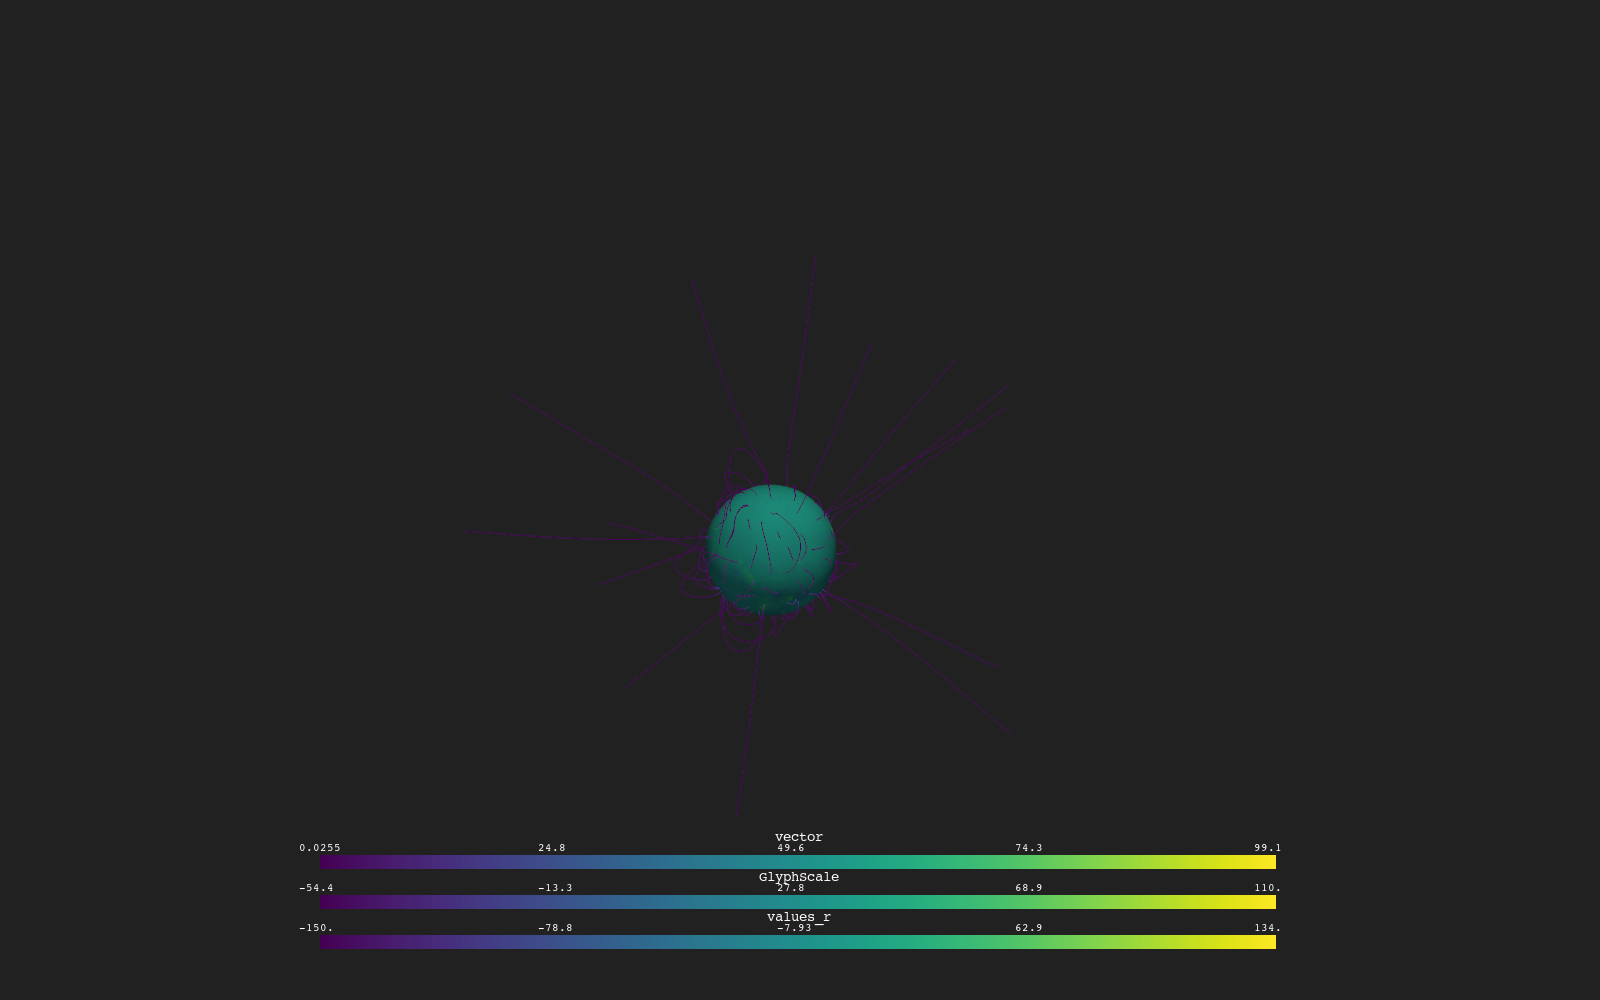
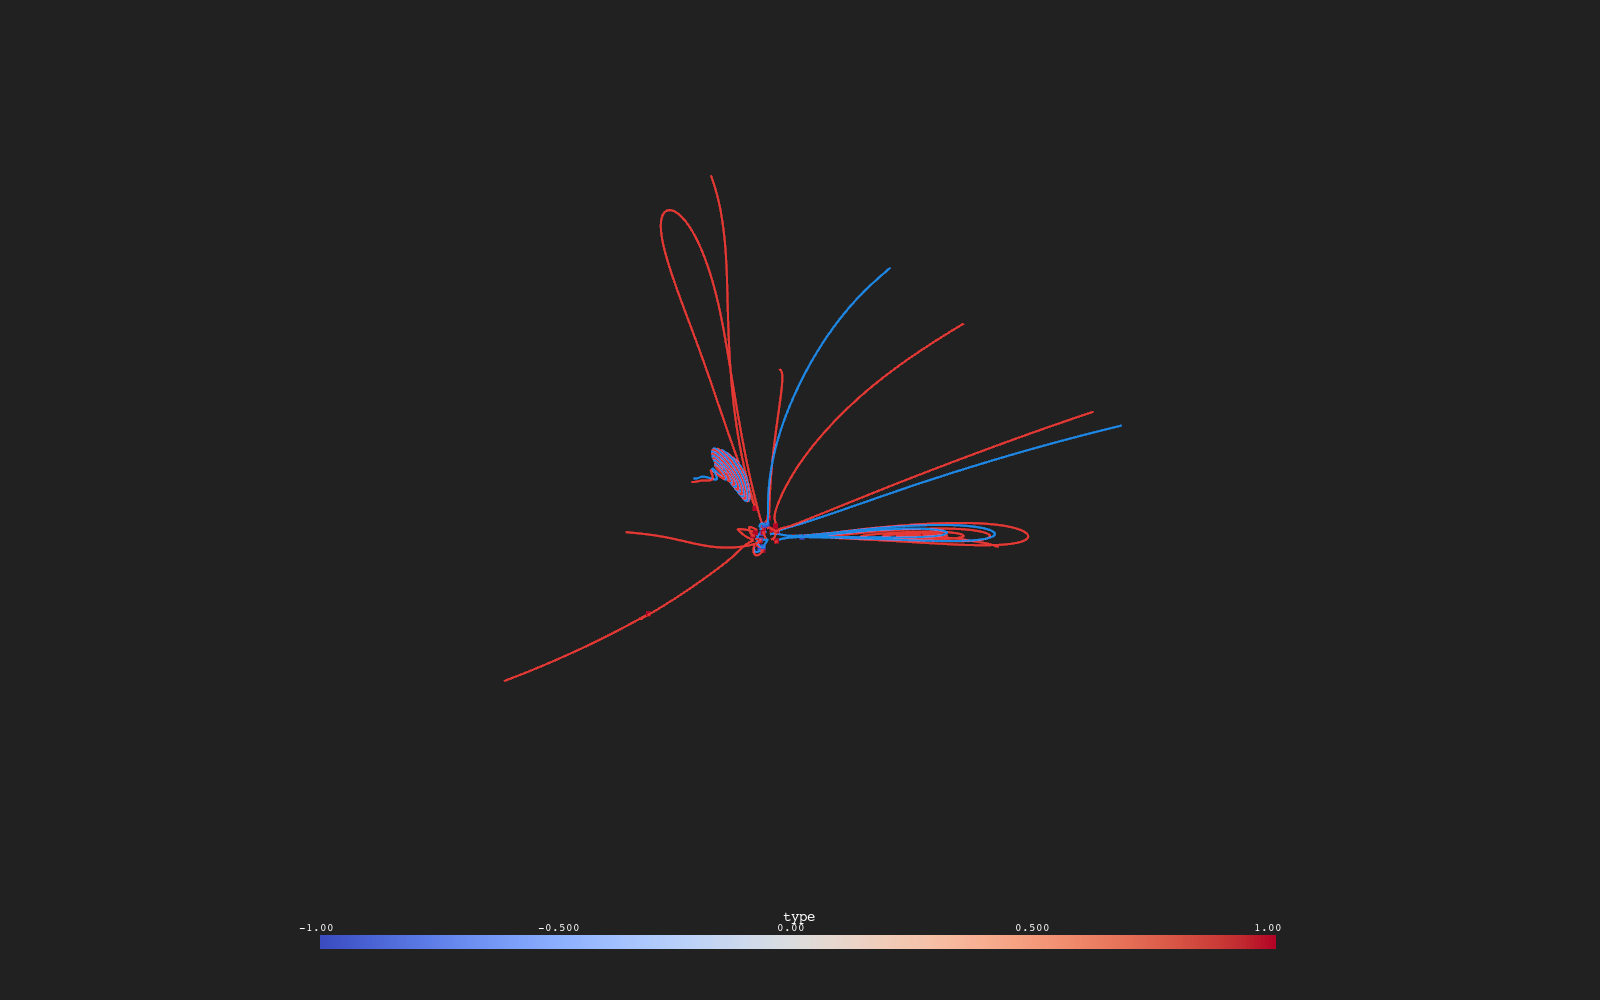
Null Point Spine Tracing starts field lines just off every magnetic null, along its spine, to show the shape of the field near each one.
54 project templates (.pyv) and 31 group templates (.pyvt): the 31 that ship with PVA plus the full library. Download one and open it in PVA, or filter by the nodes it contains.
Null Point Spine Tracing starts field lines just off every magnetic null, along its spine, to show the shape of the field near each one.
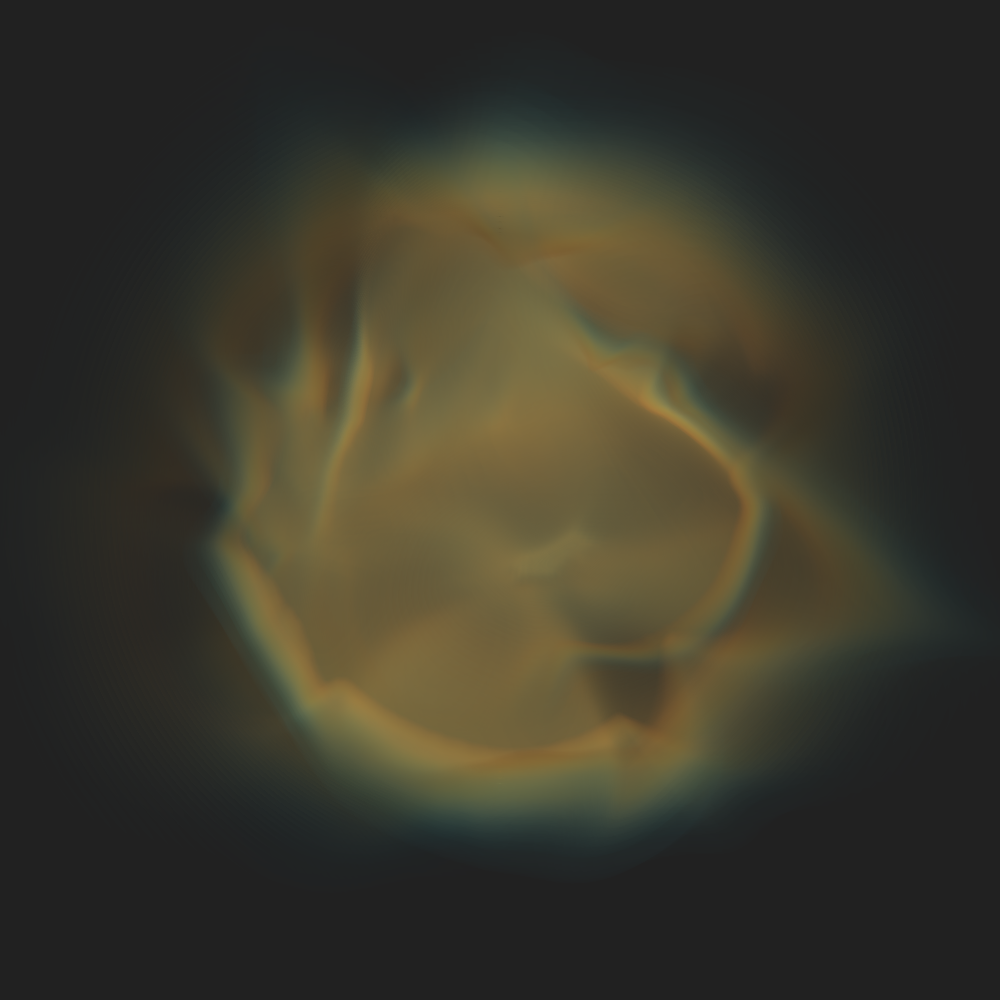
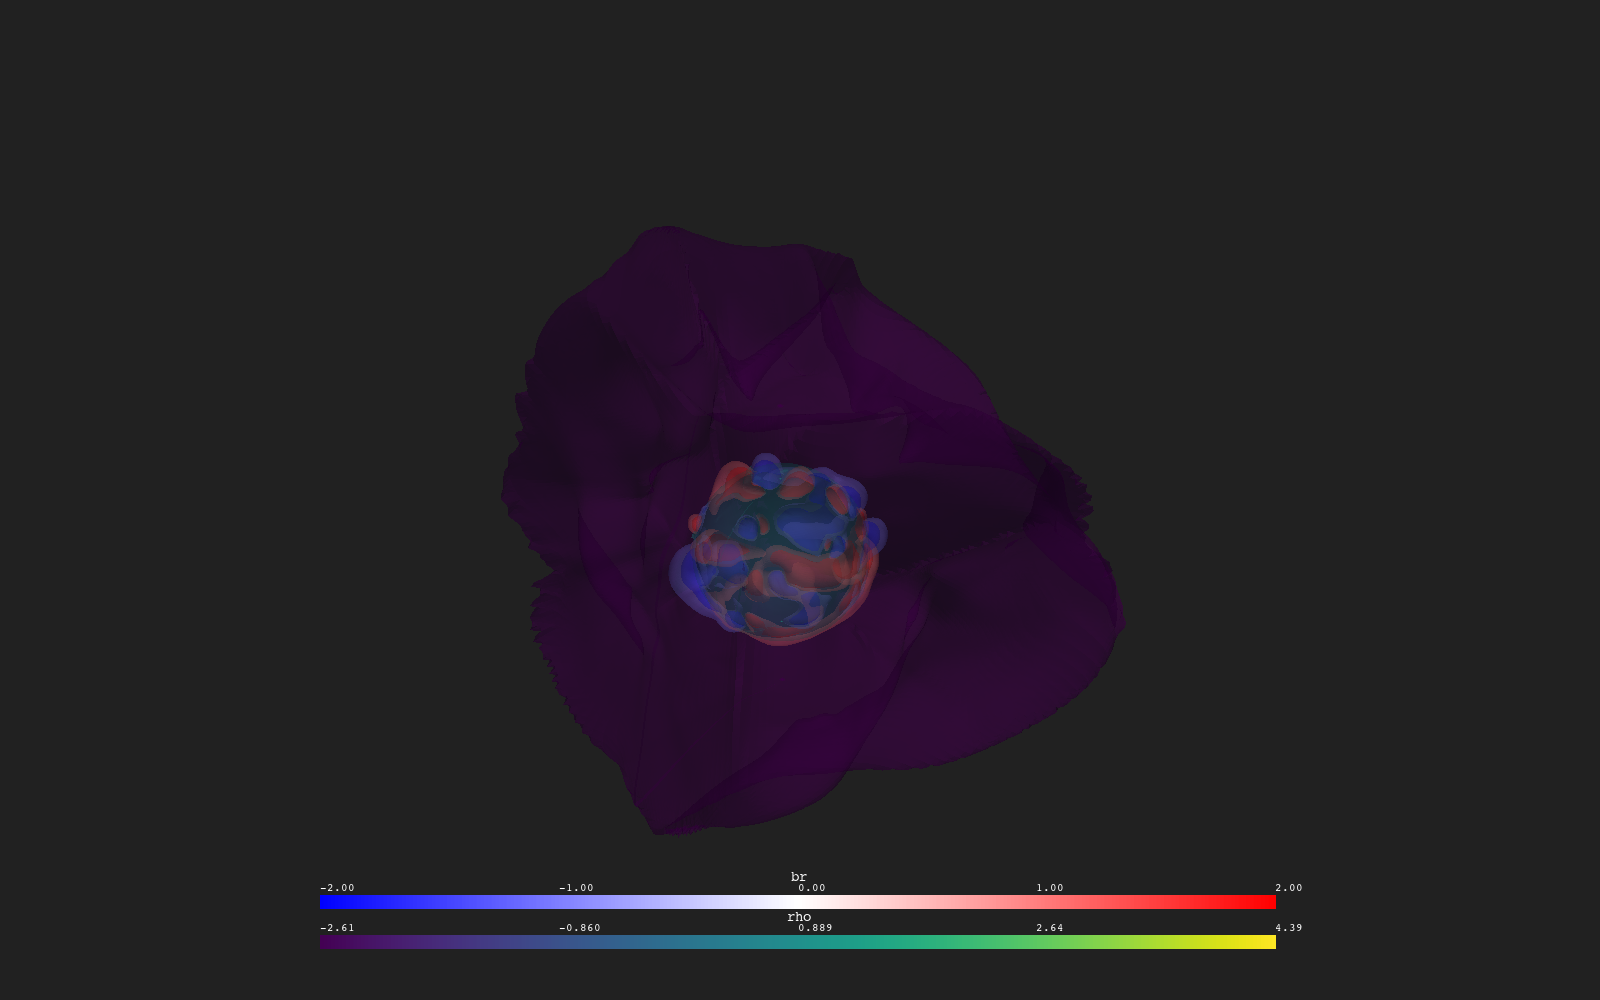
A faux volume rendering of the coronal density: every radial shell between 1 and 2.5 R_sun is drawn as one translucent slices actor, colored and faded by log10 of the de…
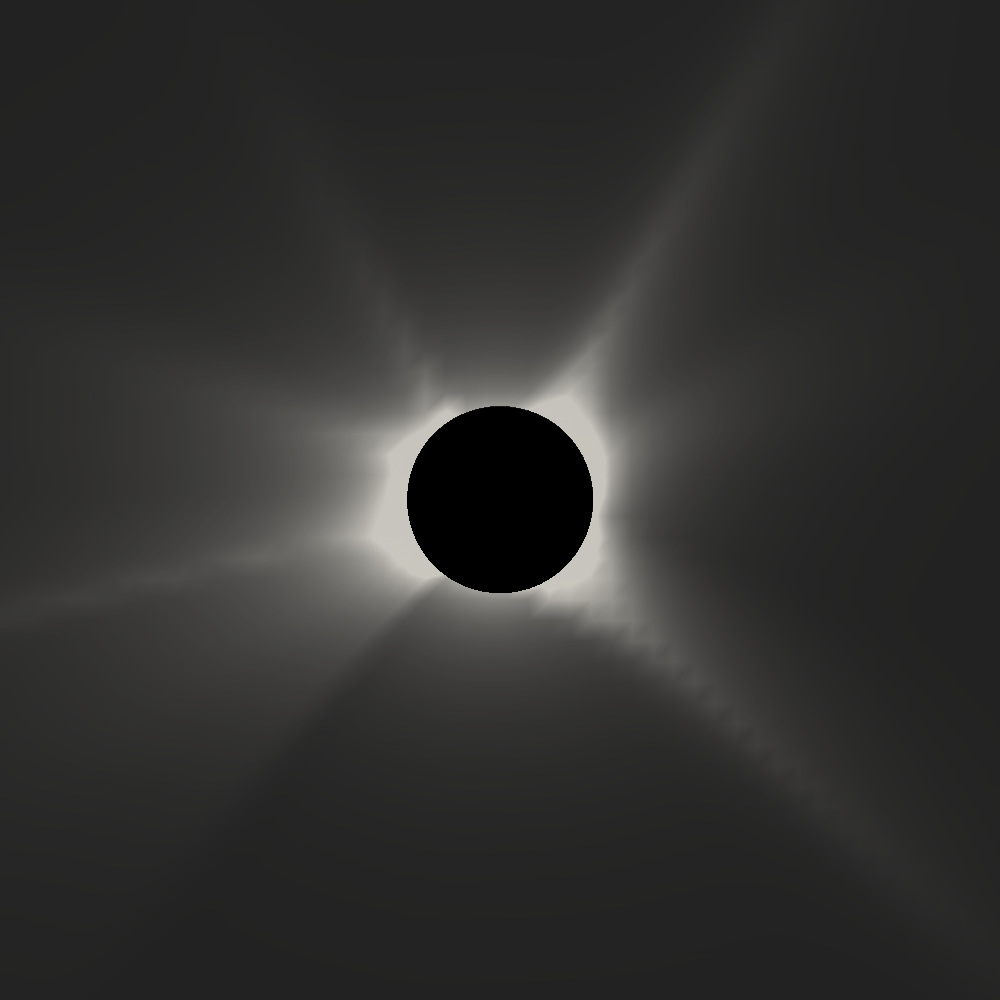
Mimics a coronagraph image: the pinned coronal density is sampled on the Thomson sphere of an observer at Earth (Read, method points), converted to log10 and shown in gr…
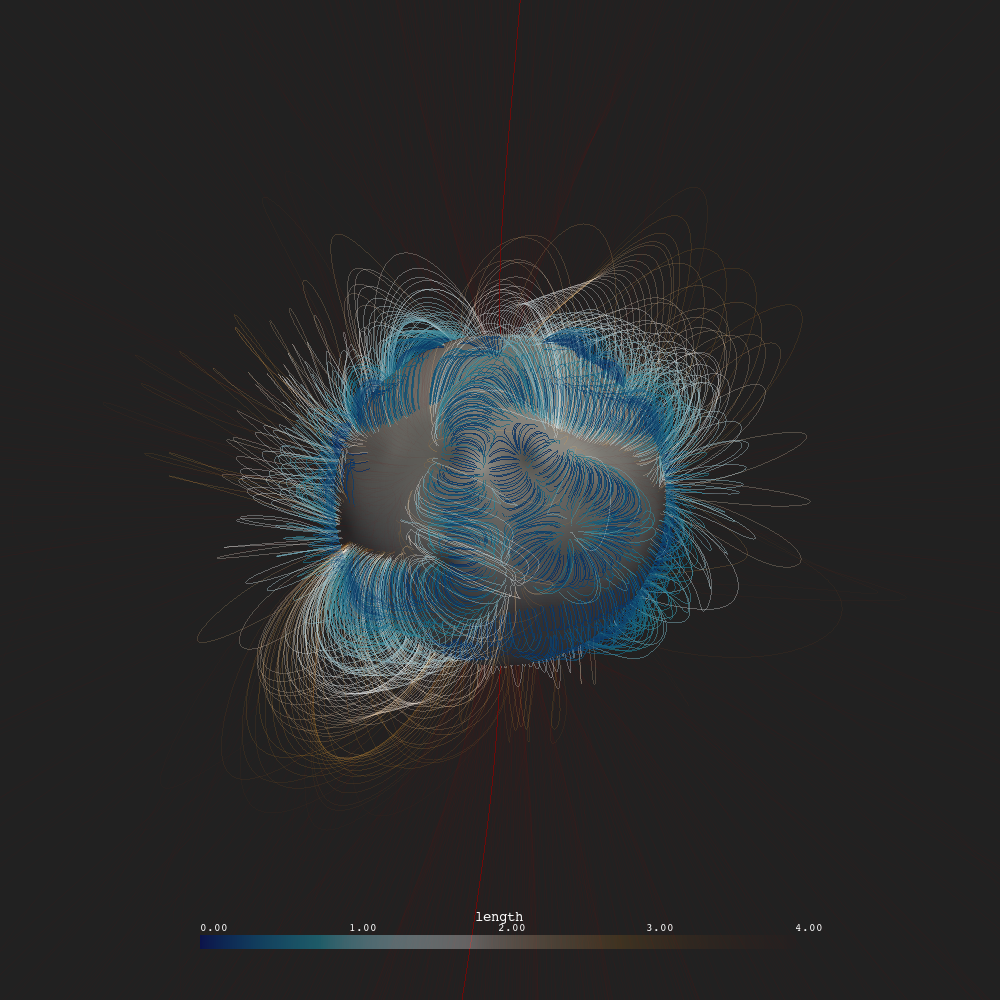
Field lines traced both ways from a thinned shell of seeds at 1.05 R_sun, colored by their length with the @line-length colormap and faded by the @line-length opacity fu…
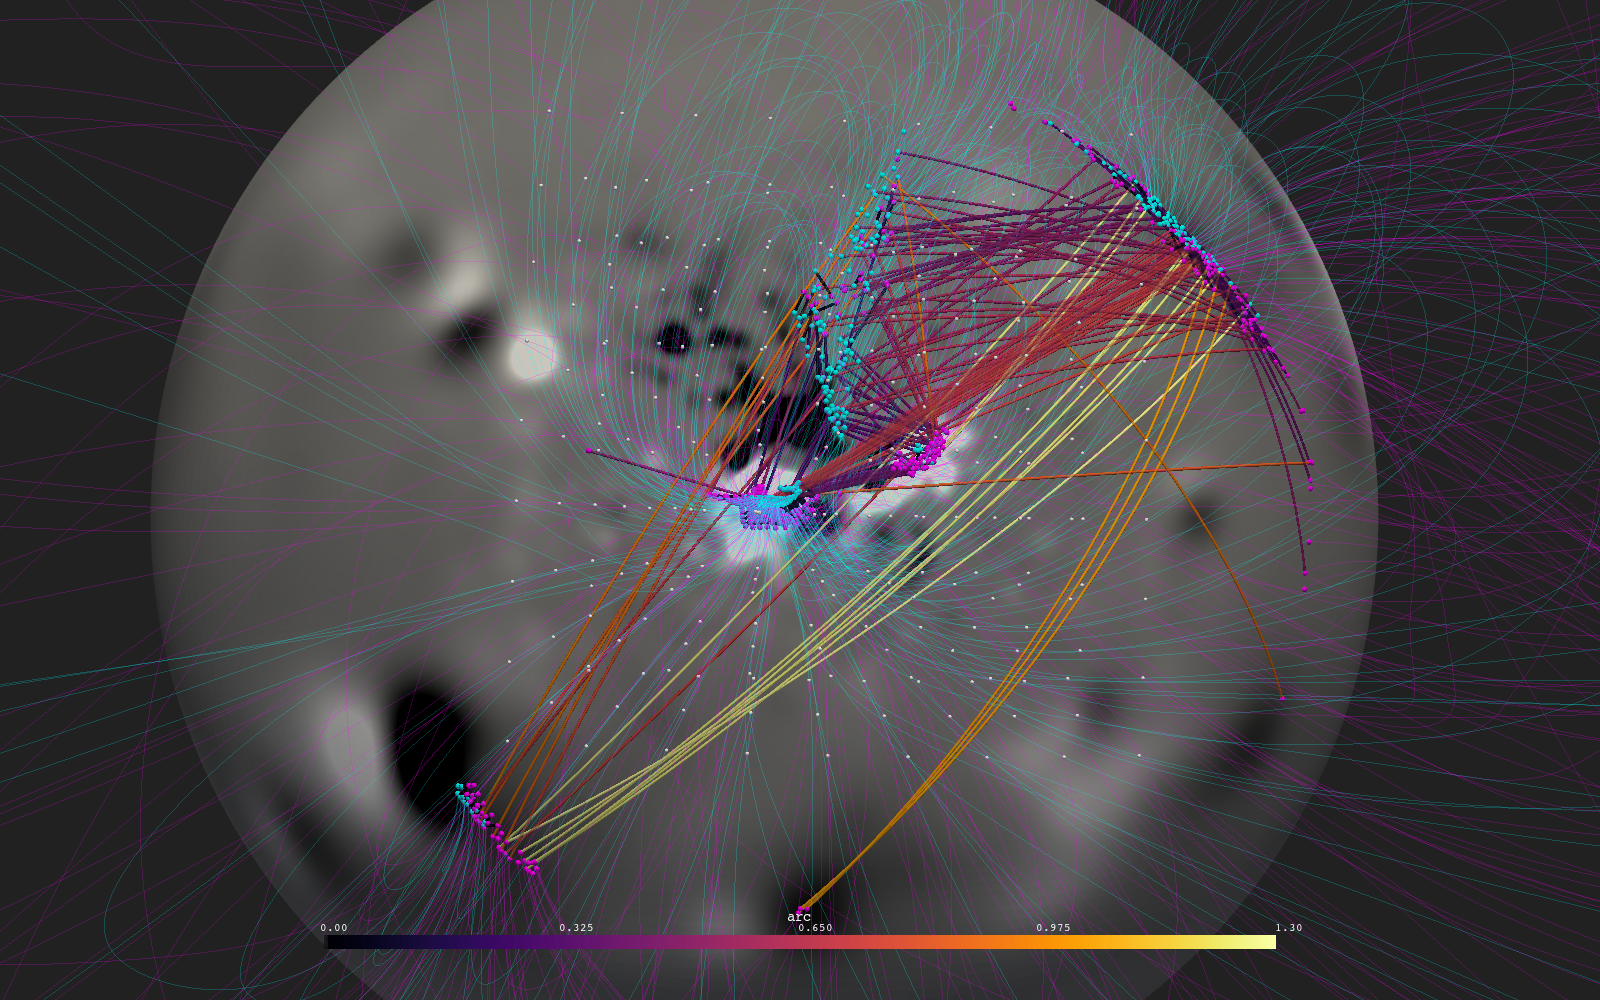
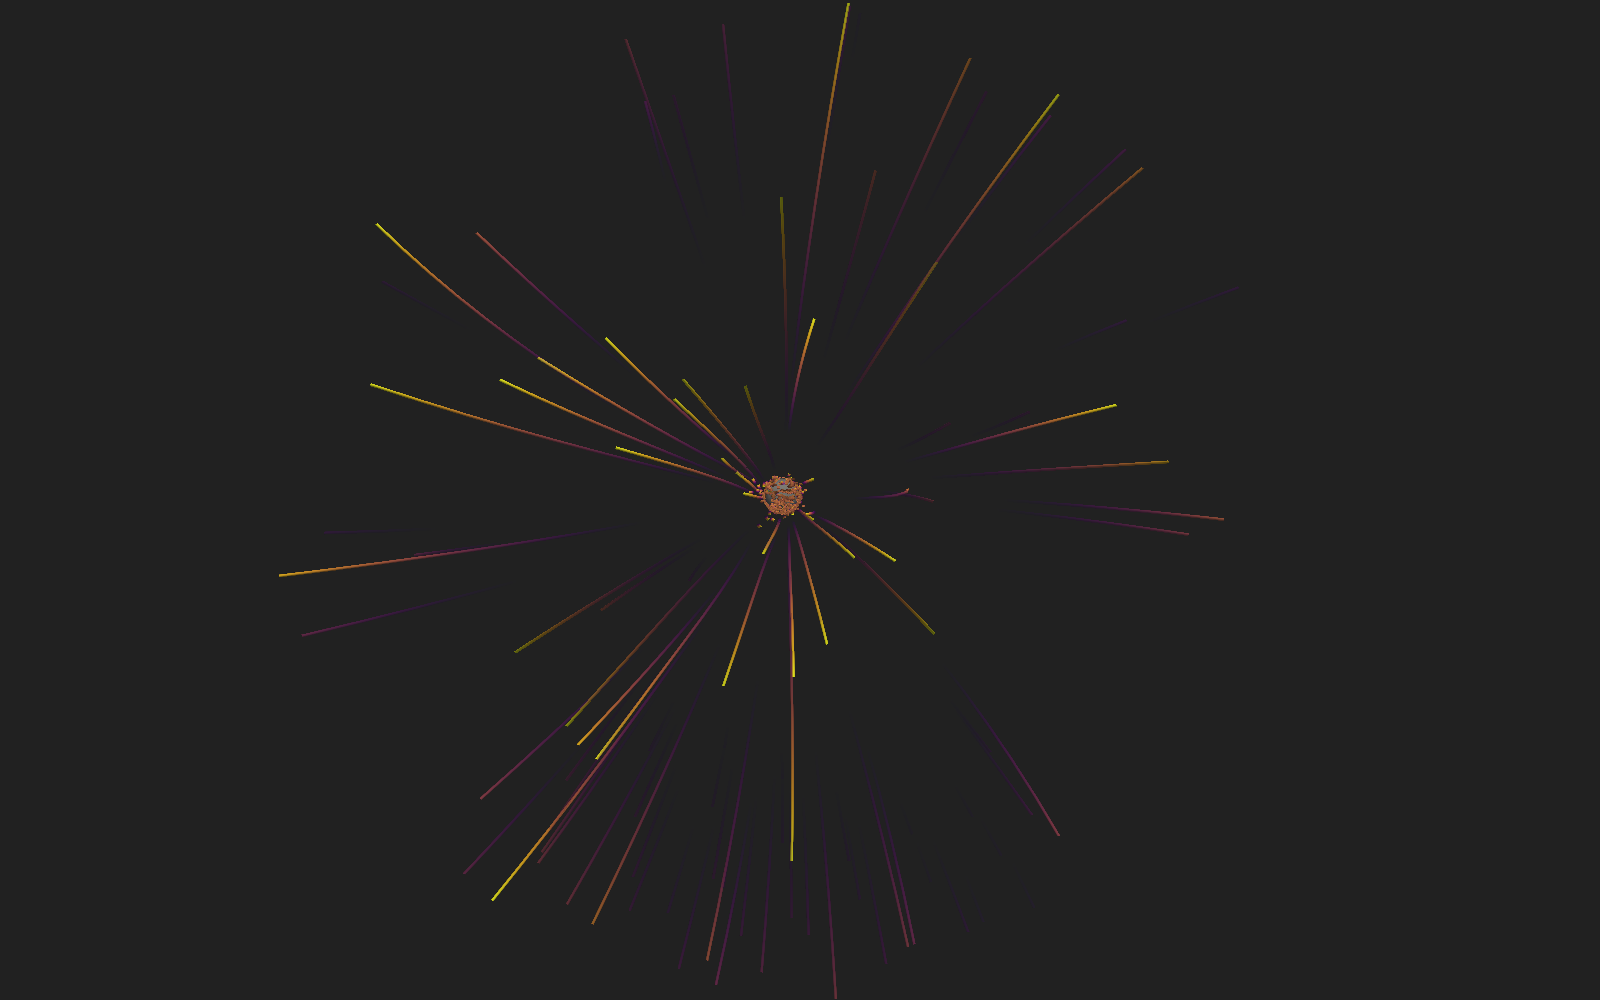
Shows how far coronal field-line footpoints move between two steps of a CME run. The same launch points are traced at step k (cyan) and step k+n (magenta), the start and…
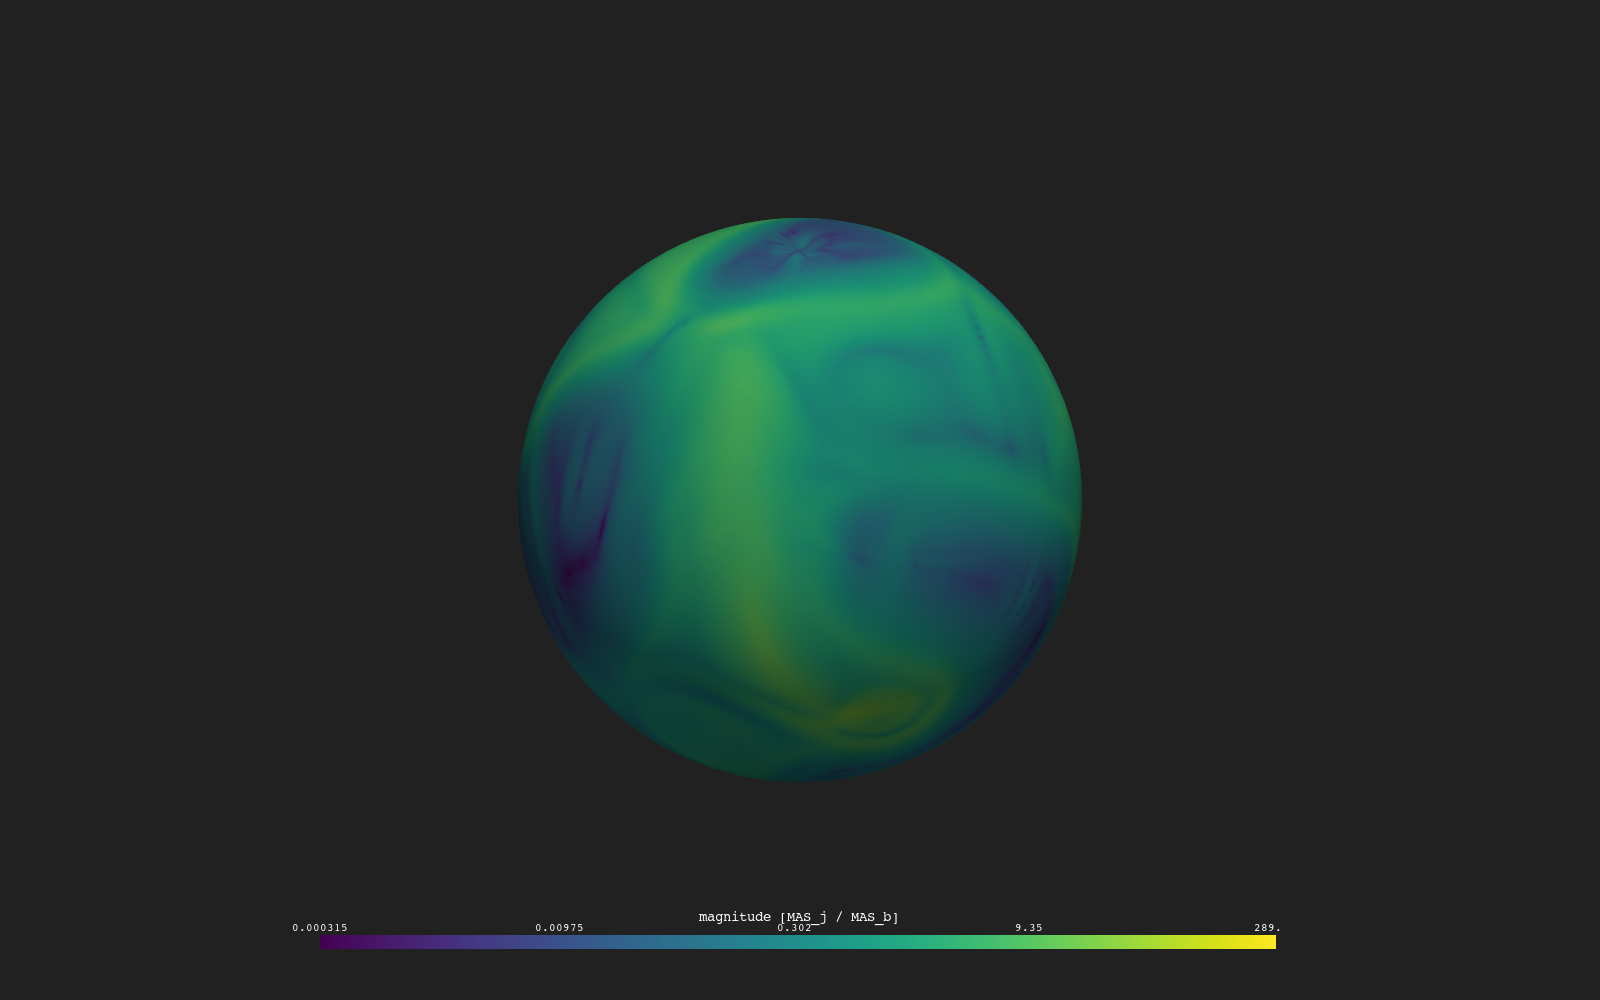
J over B shows where the current density is large relative to the magnetic field it flows through: two Vector Field nodes each merge three MAS corona readers (br/bt/bp,…
Clip by Scalar reads temperature, takes its log10, and normalizes it to [0, 1].
Current Sheet Sampled colors the current sheet (the Br = 0 isosurface, same recipe as the Current Sheet template) by a second quantity: Sample interpolates log10 density…
Ephemeris Log Radius takes log10 of just the radial coordinate of a spacecraft's trajectory (Log10's target is restricted to points_r, so theta and phi are left alone) -…
This pipeline takes several seconds to evaluate; the field-line trace from the null points is the slow leg.
Mesh Filters is a tour of three pyvista filters running over one promoted mesh: density, log10'd and normalized to [0, 1], To Mesh then makes it a `dataset(mesh)` so any…
Multiple Isosurfaces contrasts the two ways Contour can pick its isovalues: Isosurfaces uses the count-and-range form (isosurfaces: 4 spreads 4 evenly-spaced levels acro…
Finds the magnetic null points of a MAS run, waits for you to click one, and traces field lines from two small discs placed at that null, 0.03 solar radii across, one no…
Finds the magnetic null points of a MAS run, waits for you to click one, and renders a small volume of the field around it. The picked point goes through Nearest Index a…
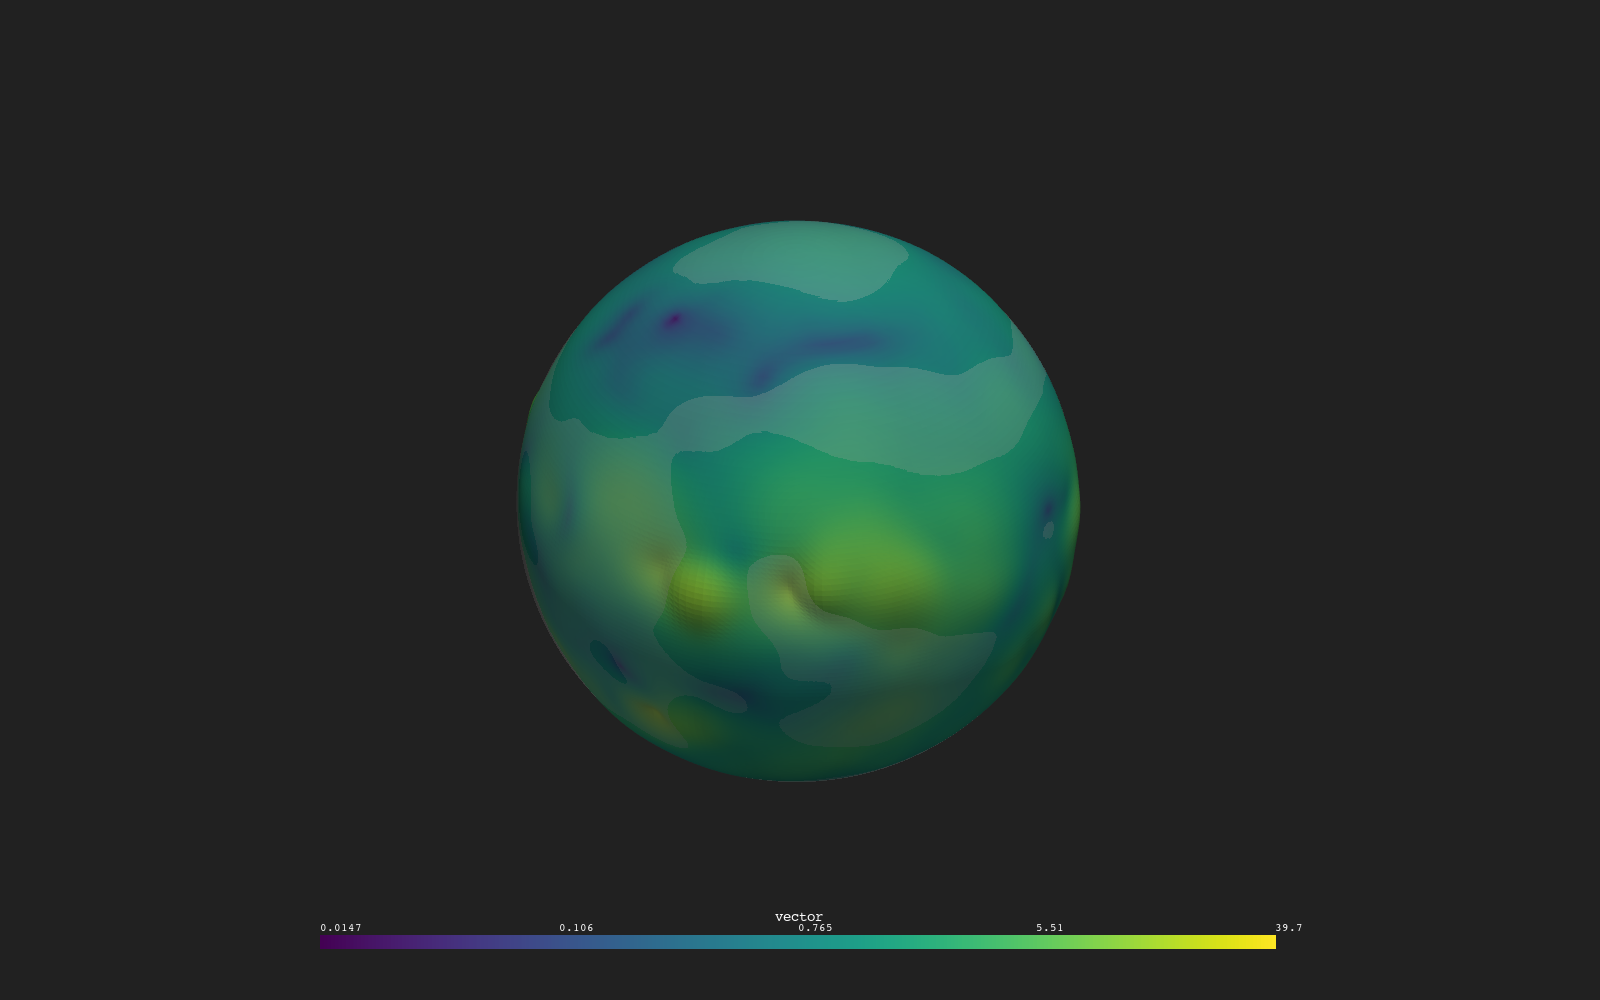
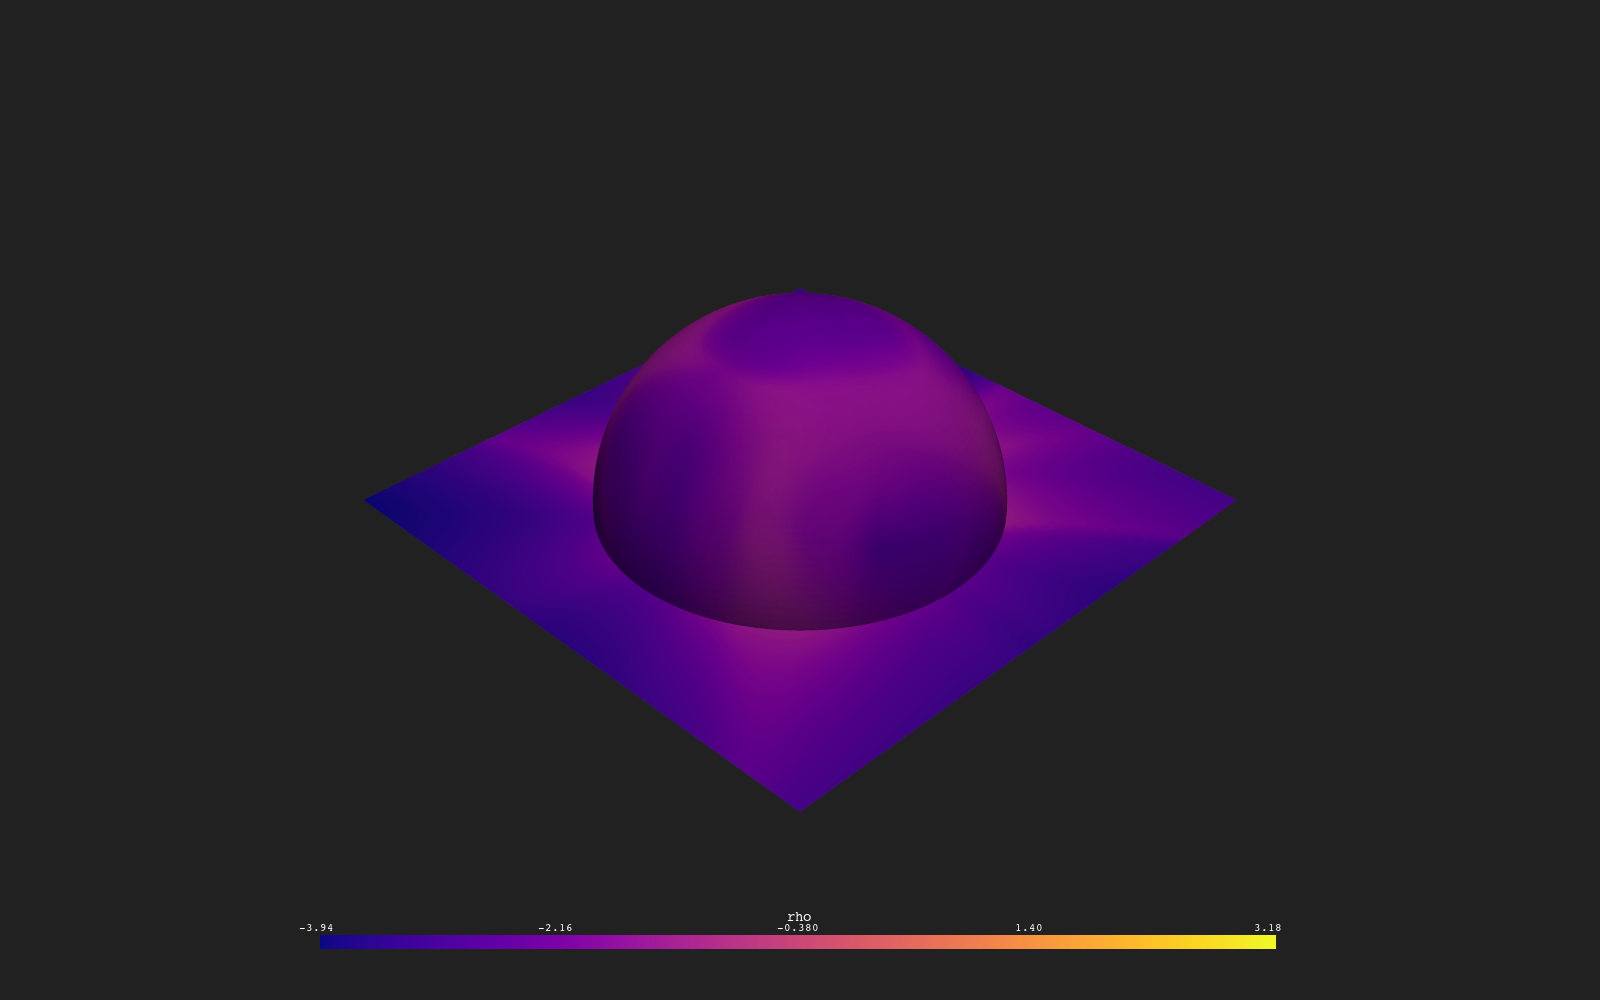
Warped Field Surface displaces the r = 1 shell along the local magnetic field, so the field's strength and direction show up as relief on the surface.
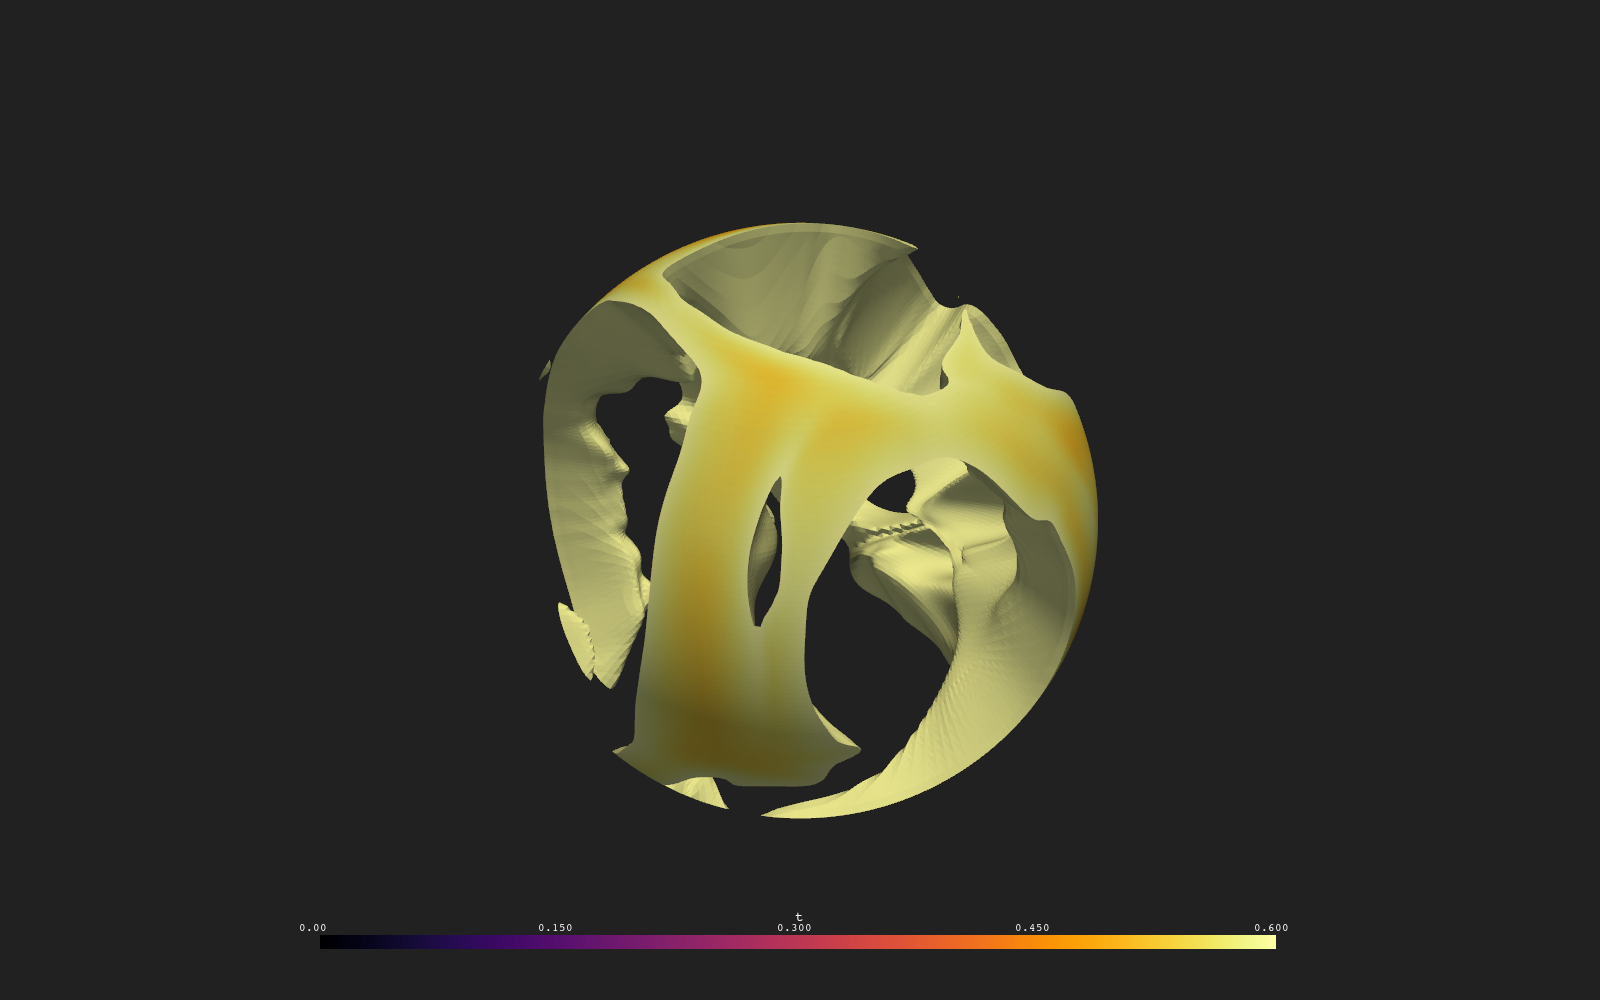
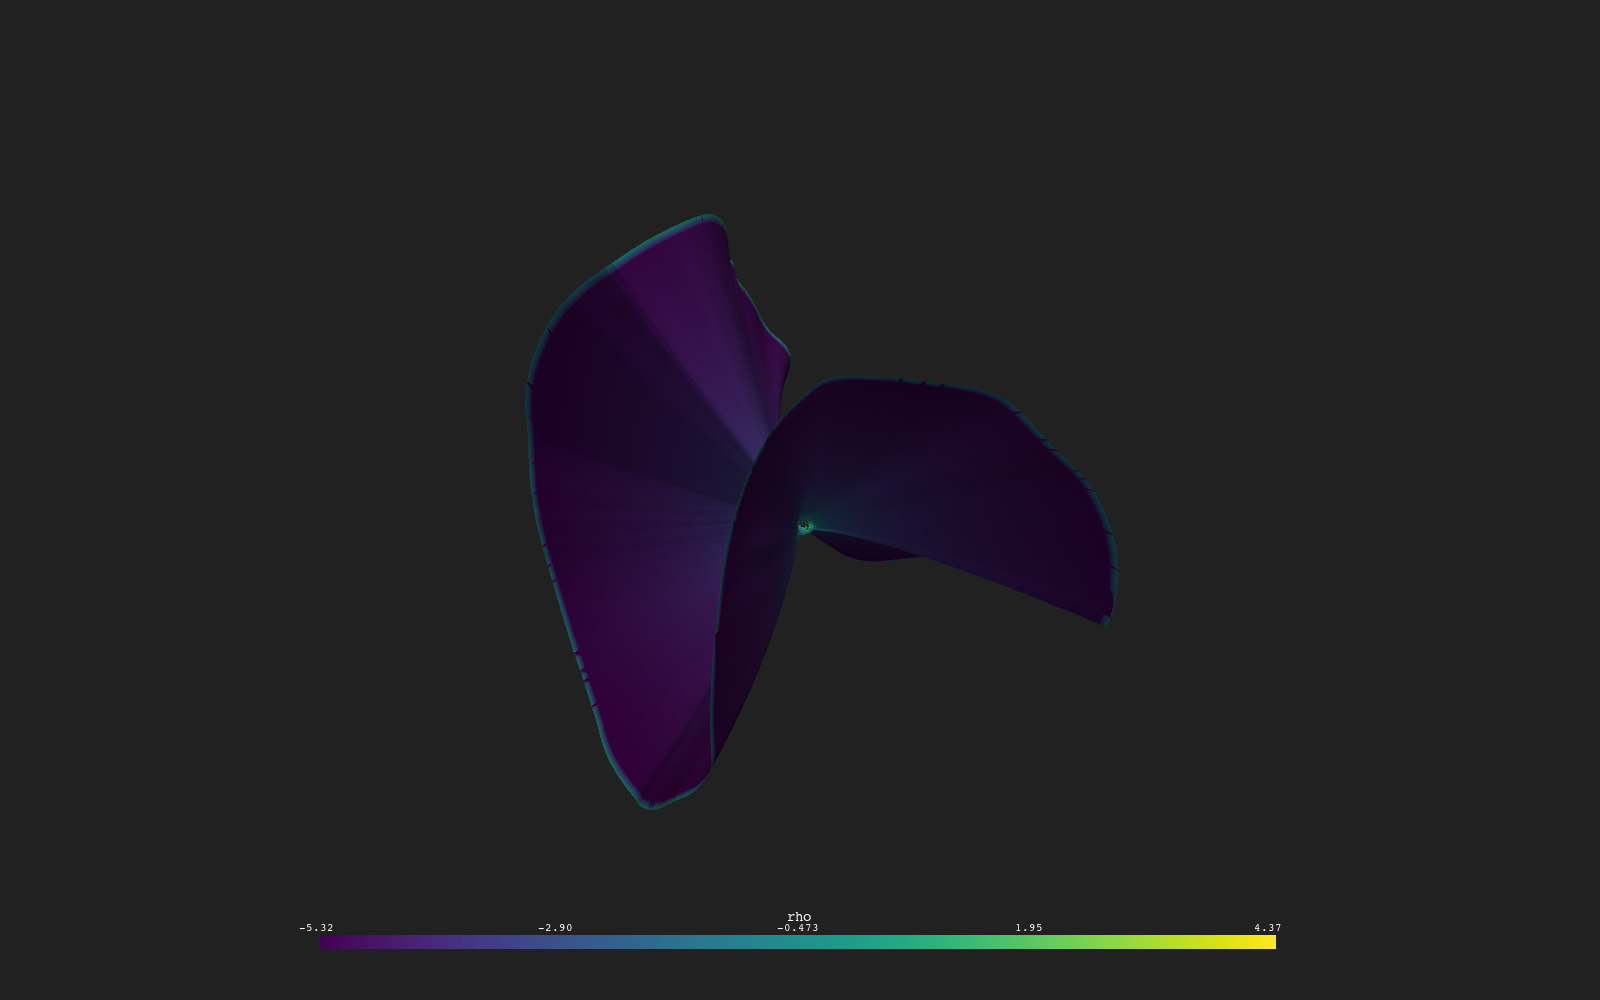
The current sheet is where the large-scale radial magnetic field reverses sign; this template renders it directly as the Br = 0 isosurface of a MAS corona run.
Fieldline File reads one line's worth of points straight out of an HDF file: Geometry File names the dataset holding the coordinates (here "Data", a 2578x3 array) and ho…
Geometry Sampling shows the Sample function: it interpolates a field (here, log10 density) onto any geometry's points, whether or not that geometry lines up with the fil…
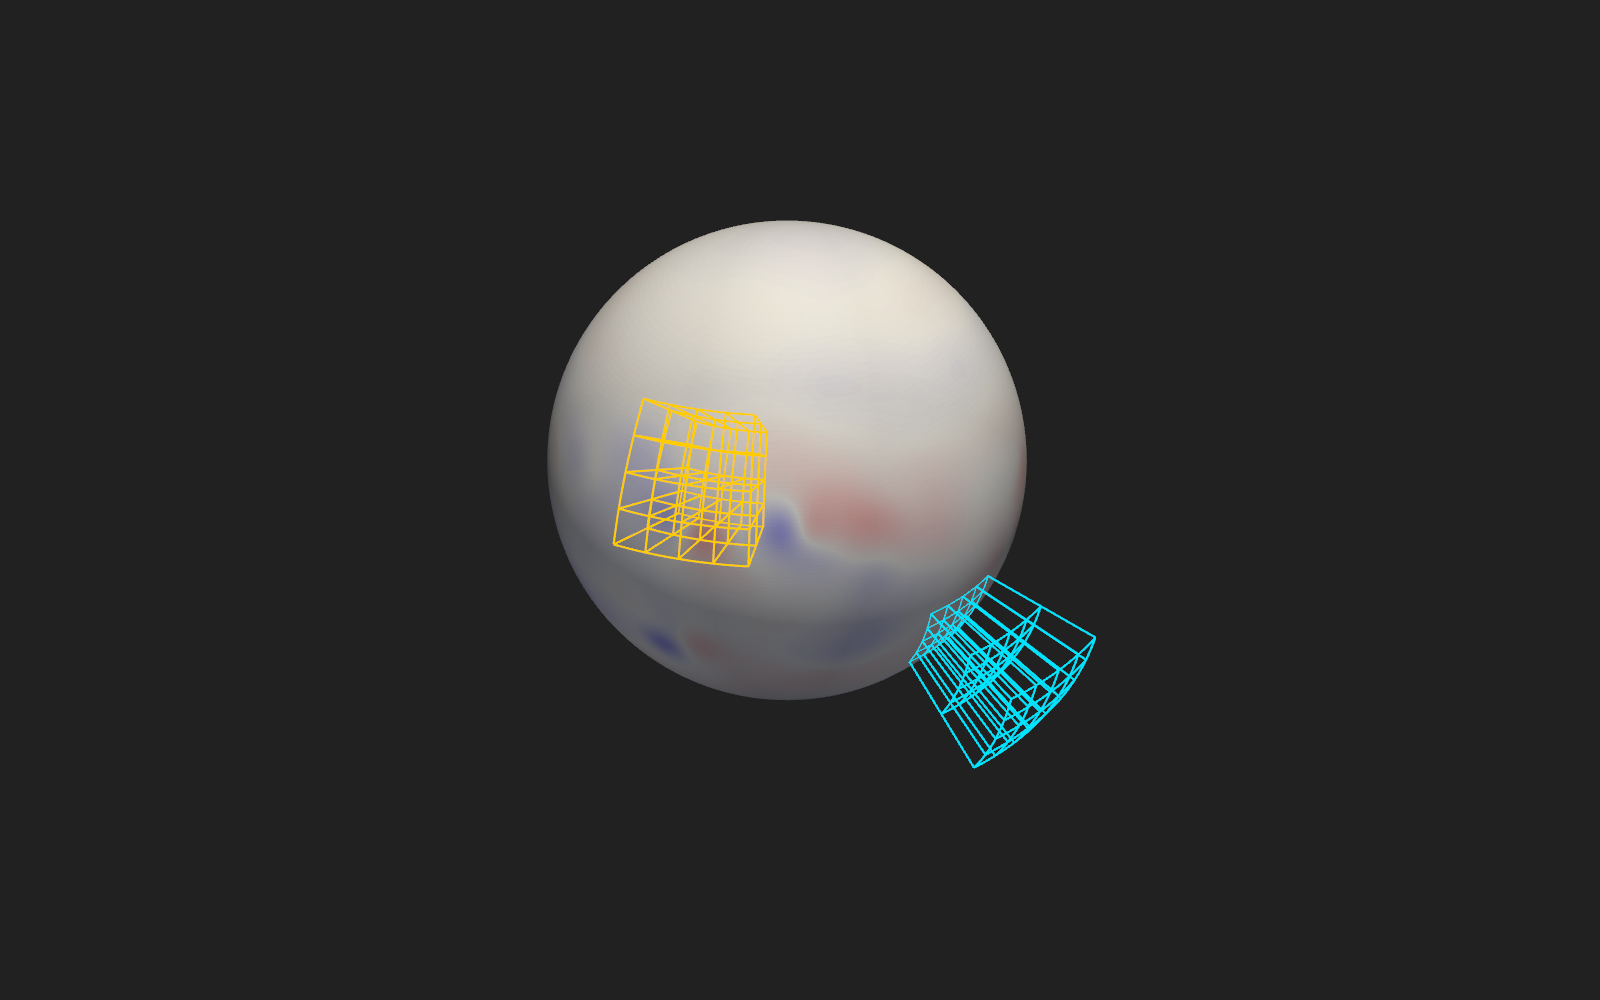
Local Grids marks two locations on the Sun with small three-dimensional grids that rise from the surface.
Longitude-Latitude Grid draws the angular reference frame of the Sun over a radial map.
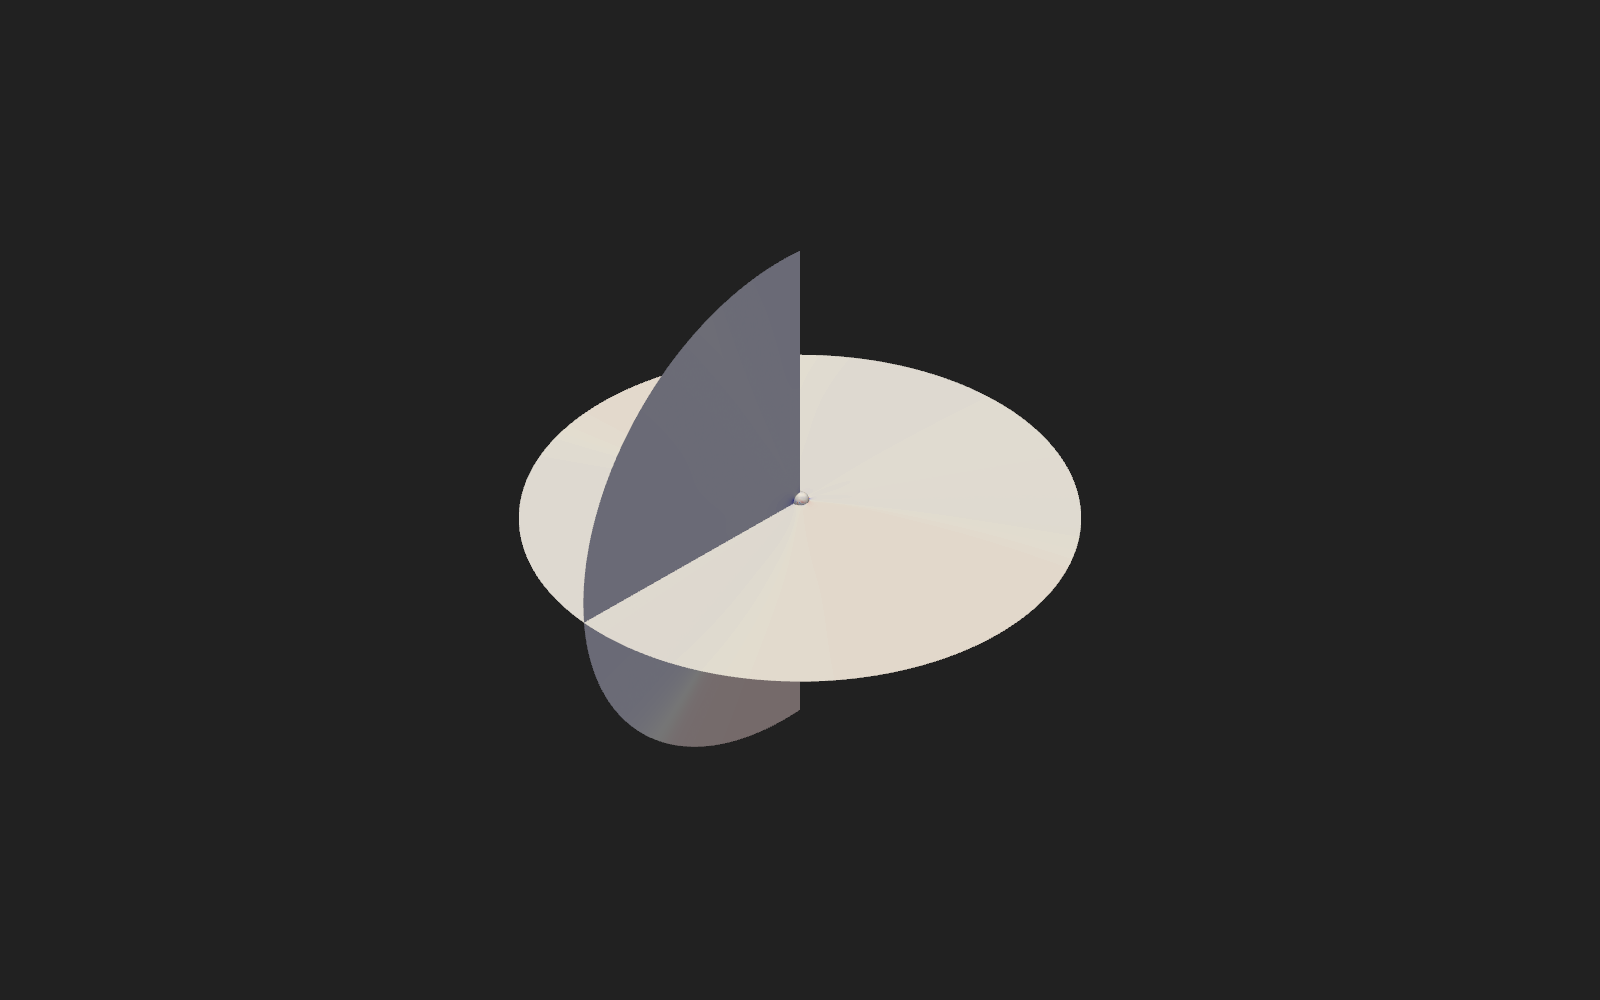
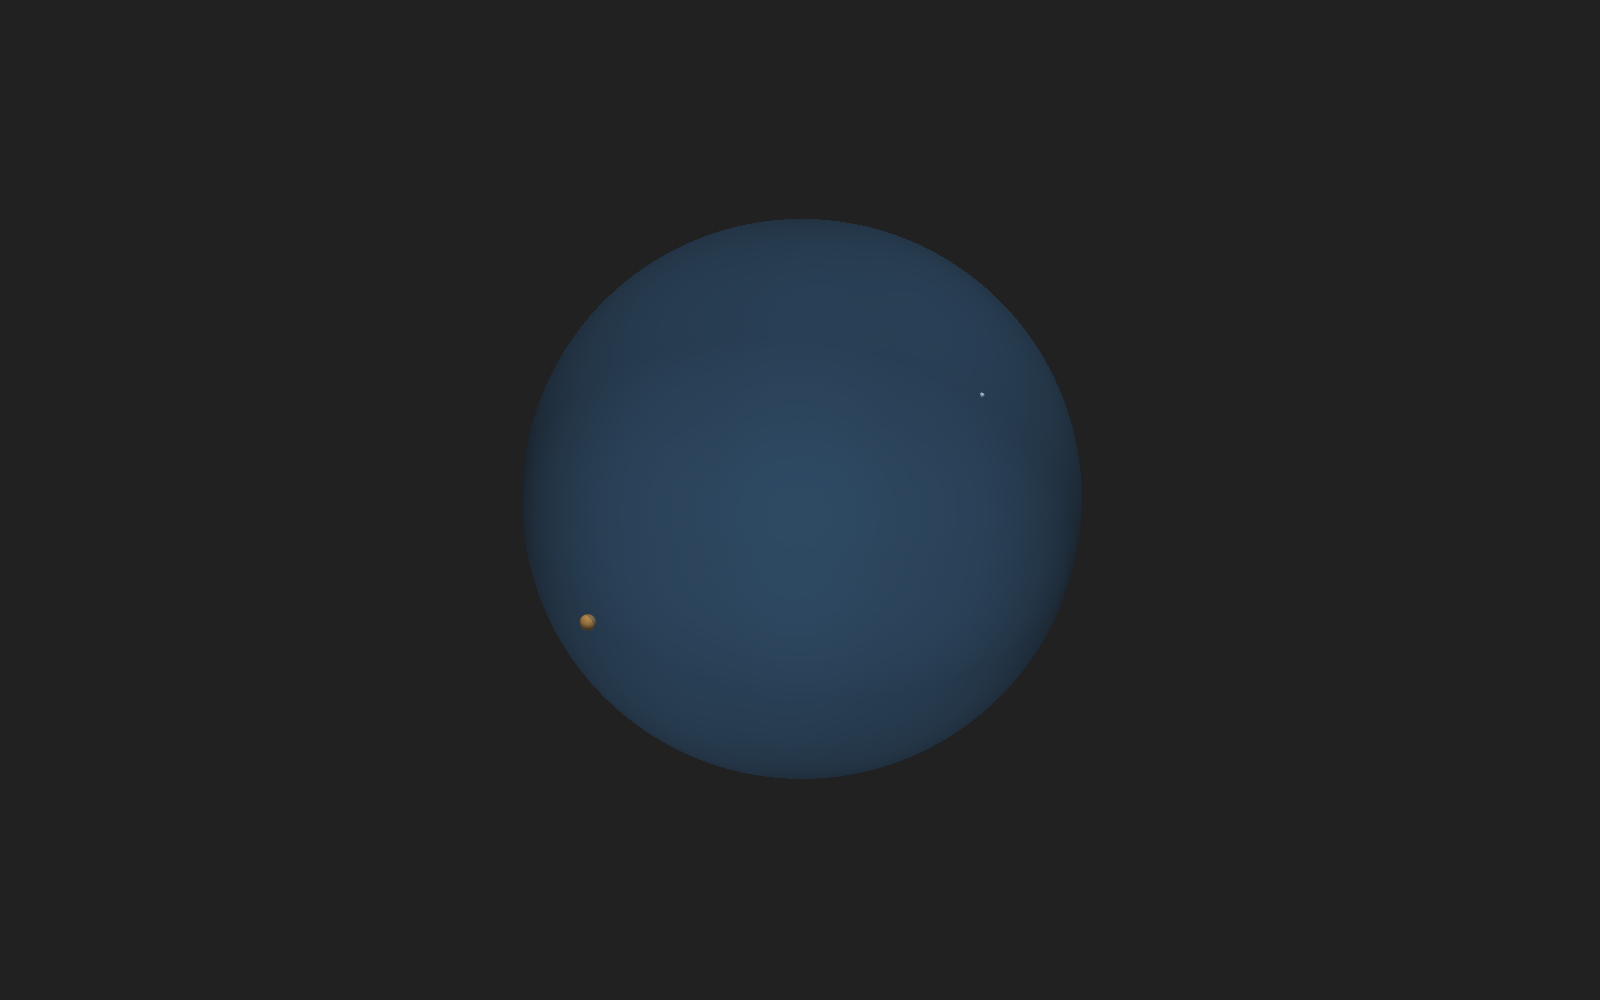
The Thomson sphere diameter equals the Sun-observer distance: with the default observer at 215 R_sun (1 AU), the sphere passes through both the Sun's centerc and the obs…
Inter-Domain Trace stitches together a coronal Tracer (MAS corona) and a heliospheric Tracer (MAS heliosphere) so field lines can cross from one domain into the other --…
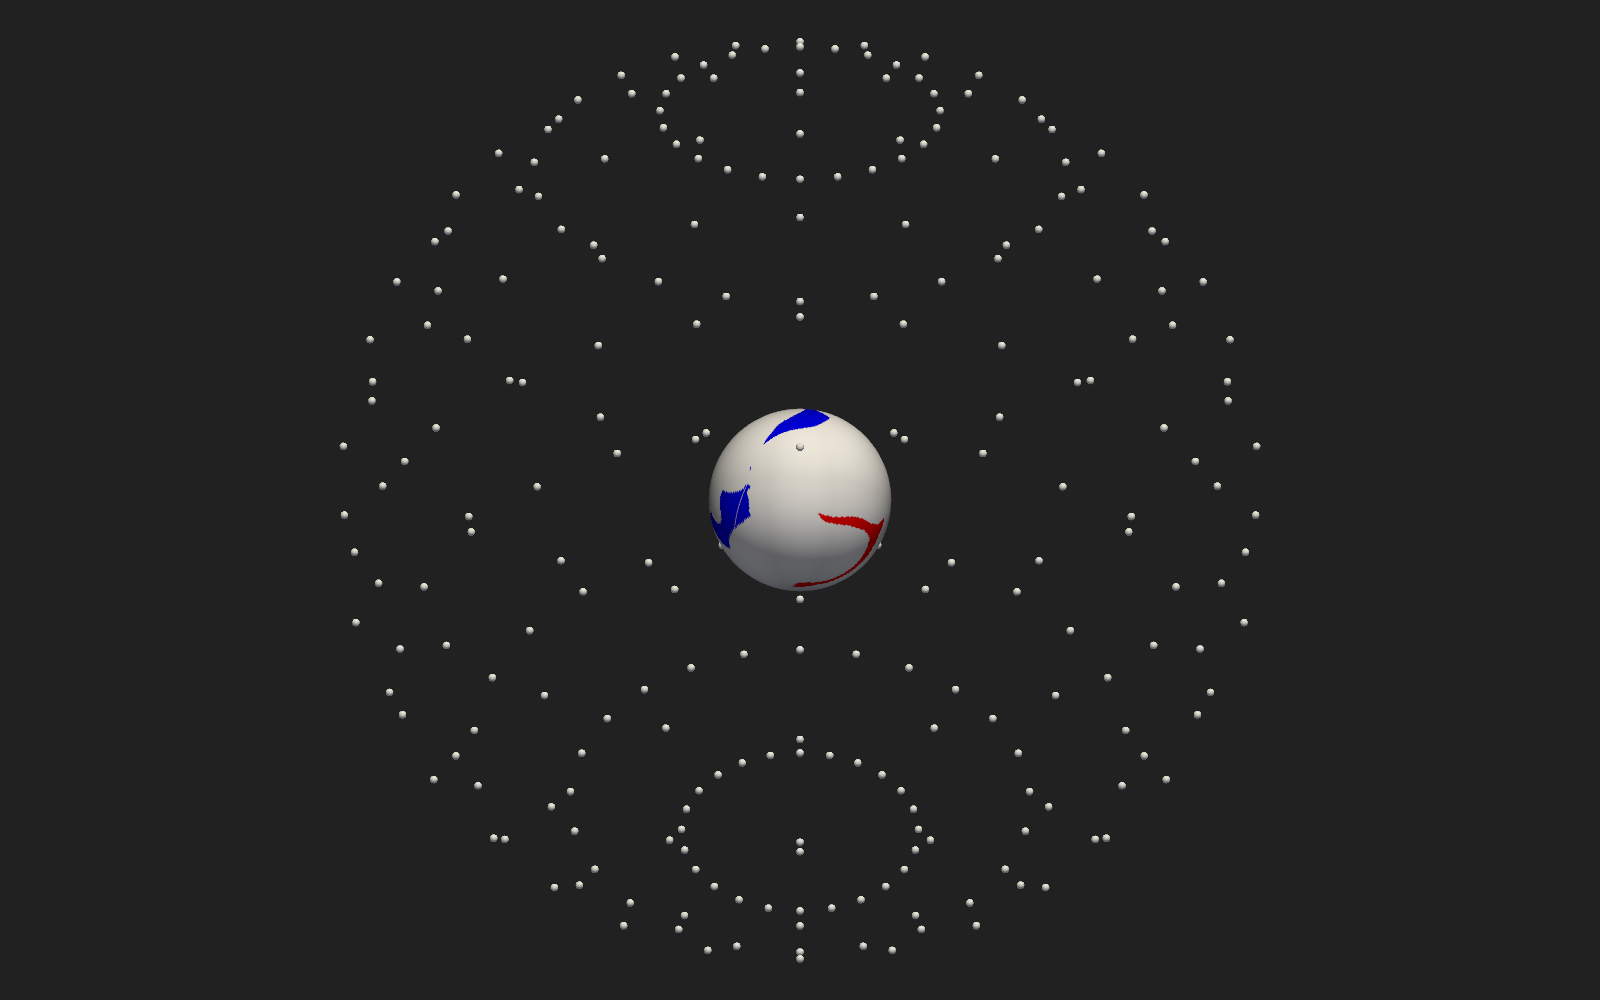
Launch Points builds an explicit set of 8 launch points by hand: three Array nodes (r, theta, phi) feed one StackMesh, which pairs them up point-by-point into a stack of…
The simplest tracing template: Trace Domain with no launch points wired in, so it falls back to its own n/r parameters -- a deterministic Fibonacci lattice of n points o…
Trace (Geometry Launch Points) shows three different ways to turn a shape into a set of field-line launch points, all traced by the same shared Tracer.
Trace (Launch Point File) launches field lines from a table of points read straight off disk: Launch Point File (a Table DAT reader) is left with a blank path on purpose…
Contours the heliospheric current sheet (the br = 0 surface) between 15 and 30 solar radii, downsamples its points to one percent, and uses them as launch points for for…
Camera Follows Pick turns picking into a camera move instead of a trace: a Pick Point holder feeds its picked position straight into a Camera node's pos port, and the Ca…
Click Cloud Trace is Click to Trace with memory: the Accumulator keeps the last 5 picks instead of just the newest one, so a short run of clicks builds up a cloud of poi…
Click to Trace launches a field line from wherever you click on the Sun's surface: a translucent, unlabeled sphere at r = 1.01 R_sun exists only to give the picker somet…
Click to Volume volume-renders a cube of log10 temperature around any point you click on the current sheet (the Br = 0 isosurface, same recipe as the Current Sheet templ…
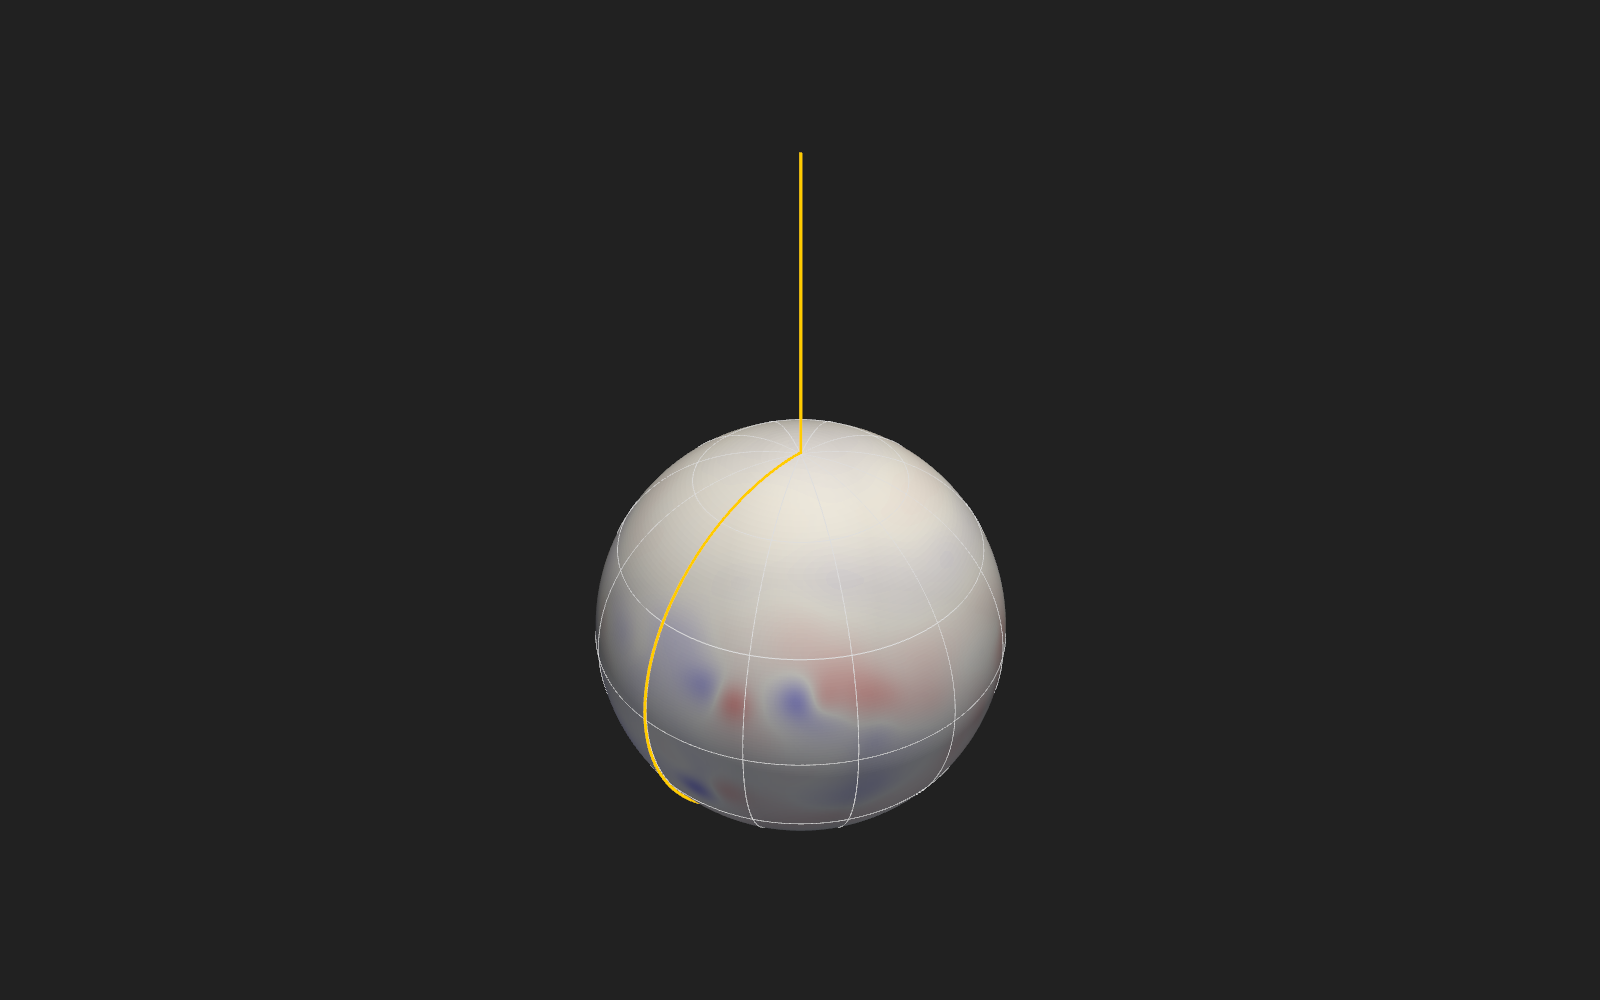
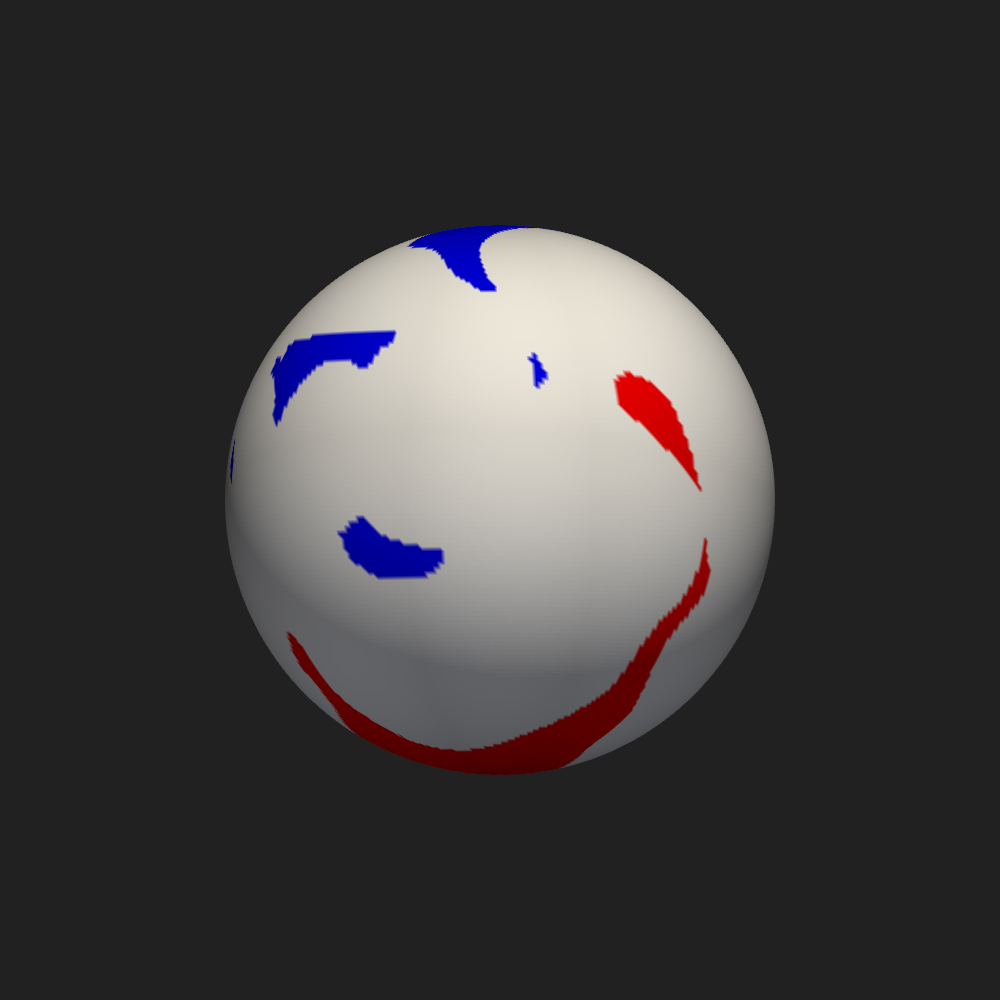
The default tracing template (Trace Domain on its own Fibonacci lattice of launch points, colored by polarity, over a coronal hole map) with one field line picked out an…
Spline Builder turns a run of clicks into a smooth curve: Pick Point is chorded to key 1 (hold Cmd, or Ctrl off macOS, plus 1 while right- clicking, so it does not fight…
Two Plotters (Camera) opens a second Plotter (Plotter B) as its own dock, driven entirely by picks made in the first.
Two Plotters (Trace) is the tracing twin of Two Plotters (Camera): pick a point in Plotter A, and the resulting field line renders in Plotter B instead of A.
Ballistic Map reads a precomputed table of spacecraft positions and their ballistic mapping to a fixed boundary radius, rather than computing the mapping itself: the tab…
Ephemeris Camera walks the view along a spacecraft's own trajectory: Earth's week-long ephemeris (2024-01-01 to 2024-01-07) feeds a Stack Slice node (method: value, time…
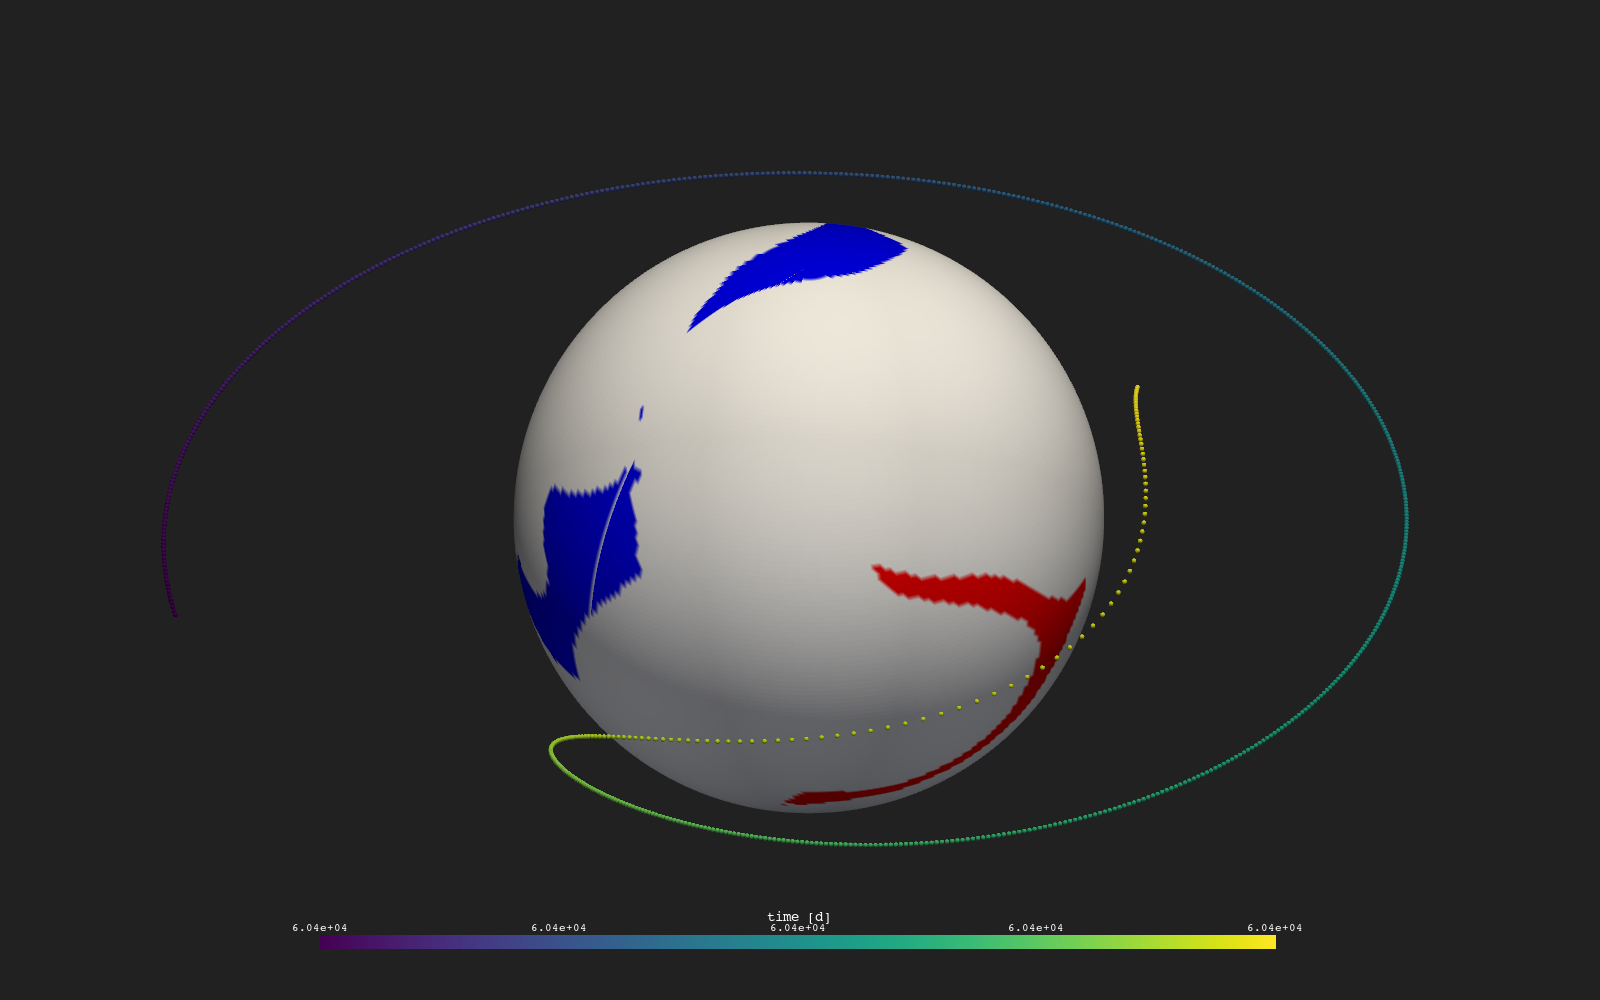
Ephemeris Plot fetches one spacecraft's Carrington-frame trajectory and plots it as points -- hourly (r, t, p) positions from JPL Horizons, cached locally so repeat eval…
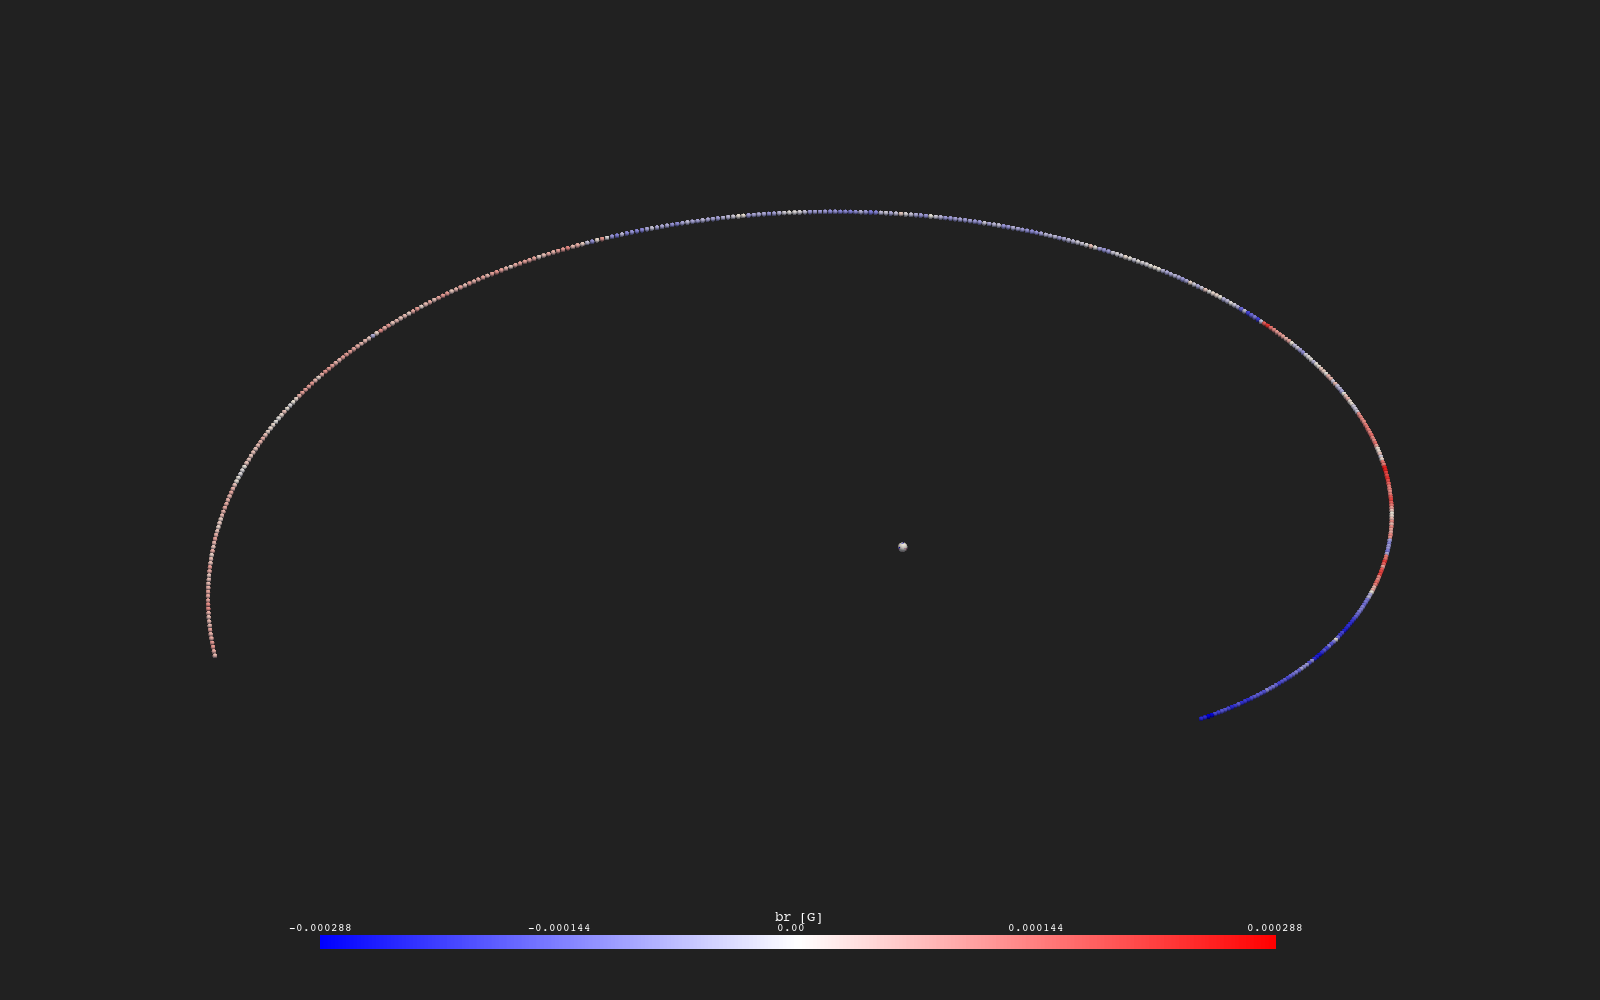
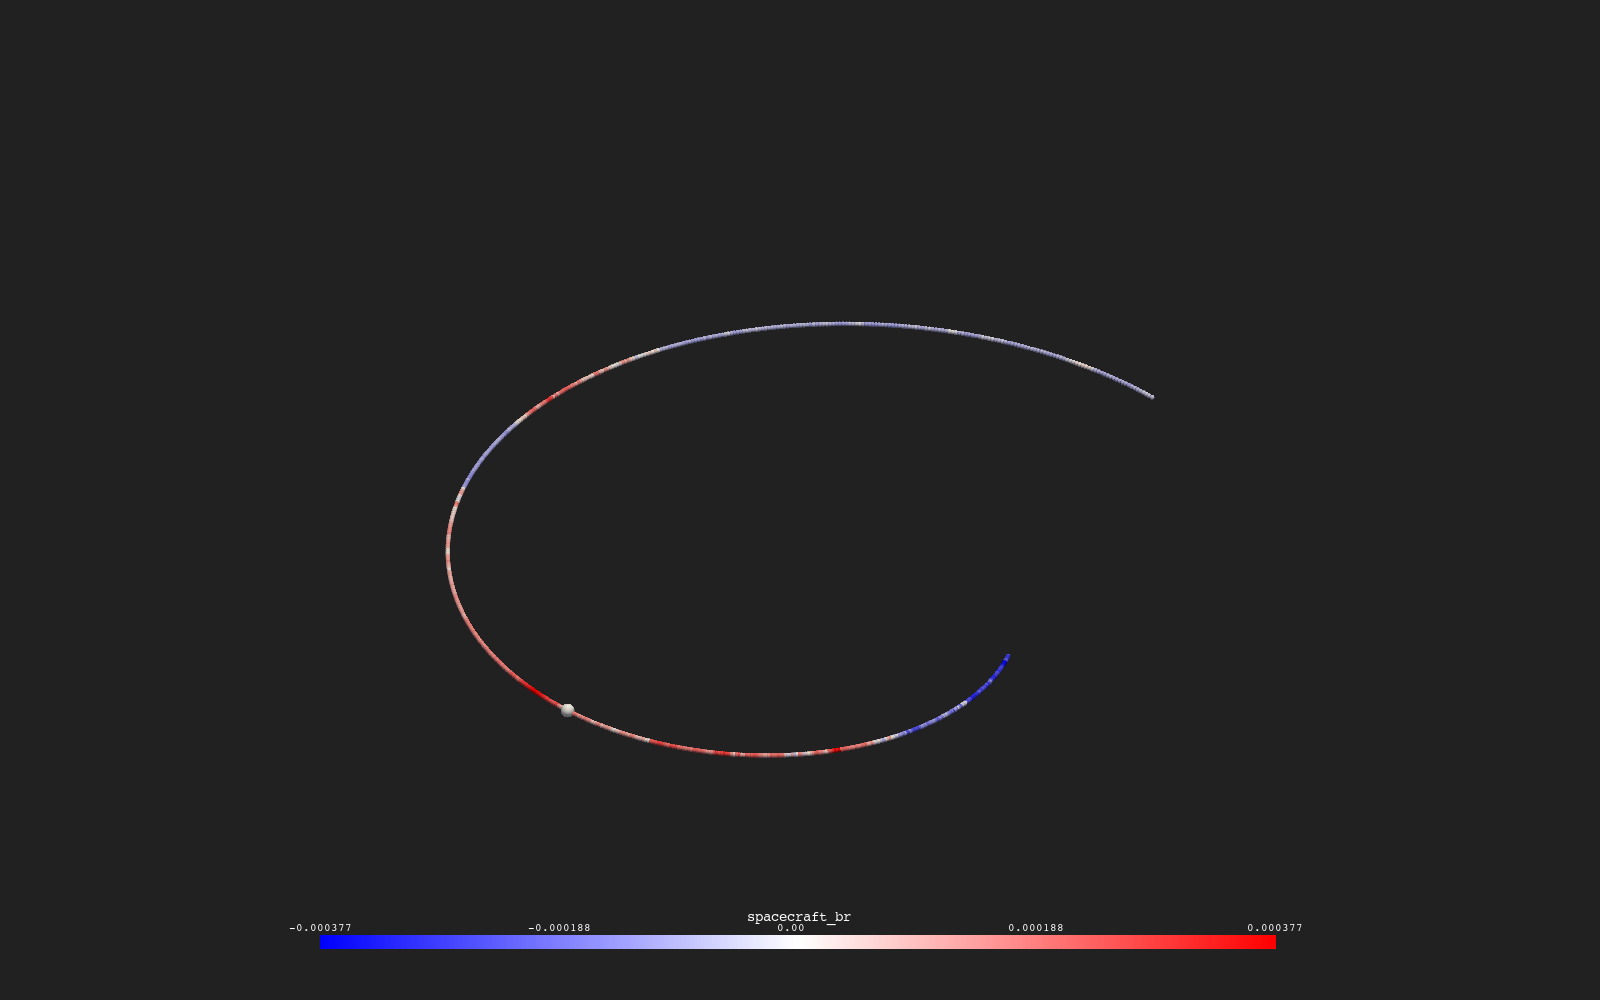
In Situ vs Model compares a spacecraft's own measured Br against the same quantity sampled from a MAS heliosphere model, side by side in two Plotters.
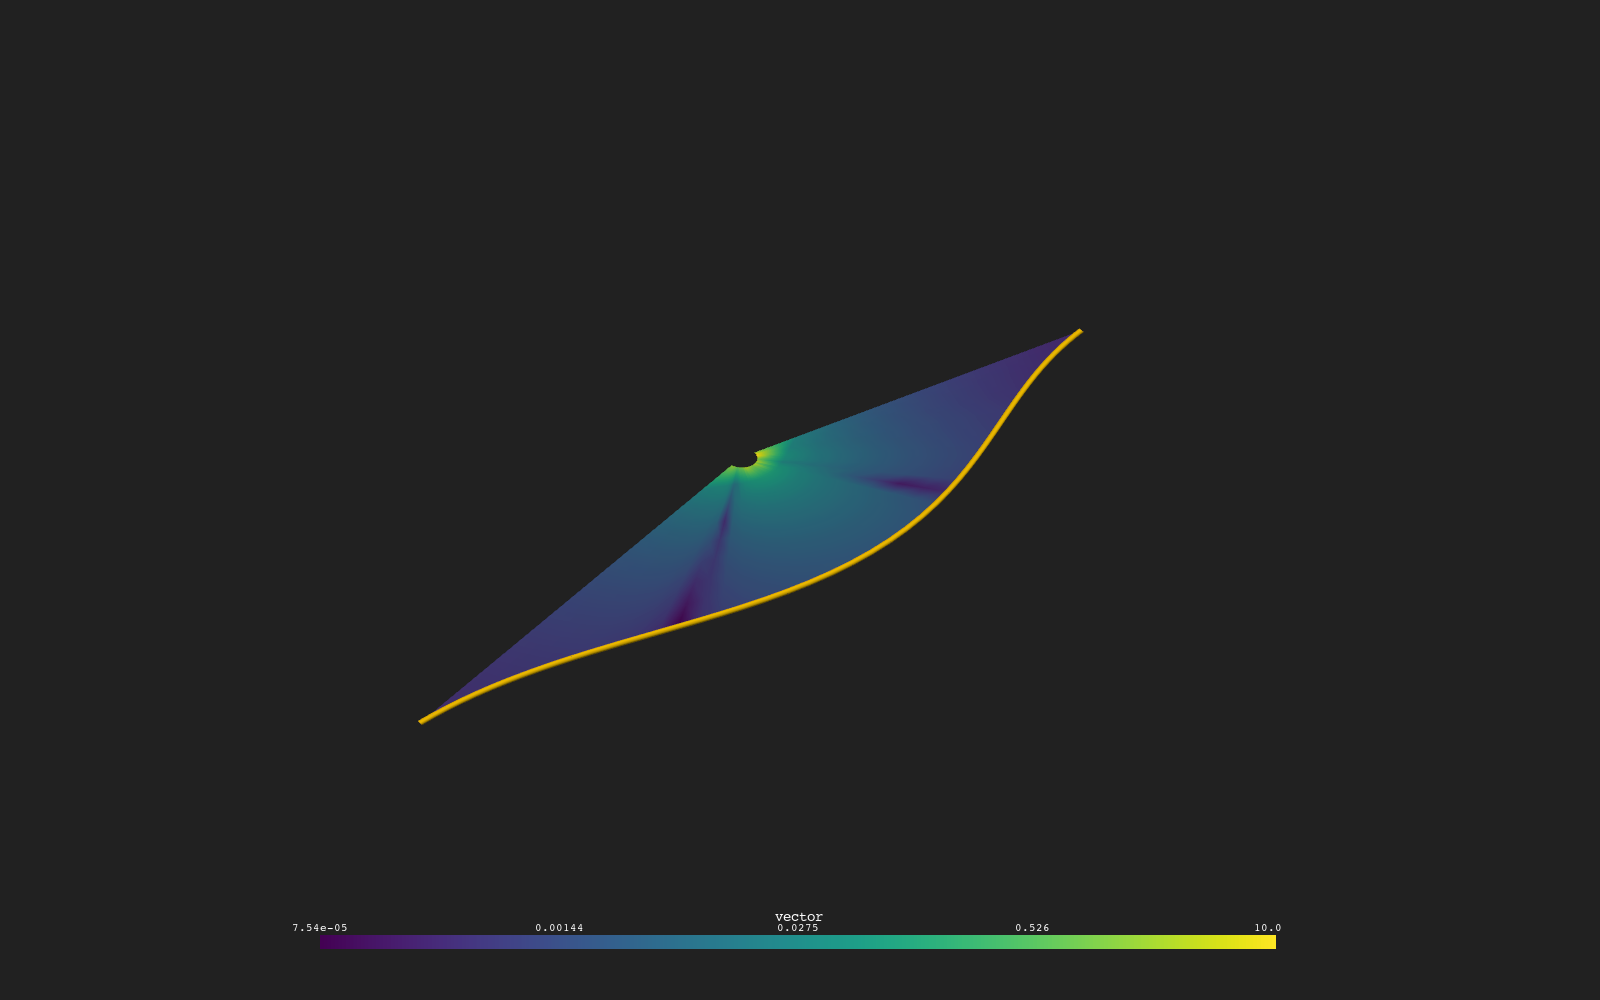
Spacecraft Curtain hangs a ribbon of the magnetic field under a spacecraft's path, from just above the solar surface up to the probe.
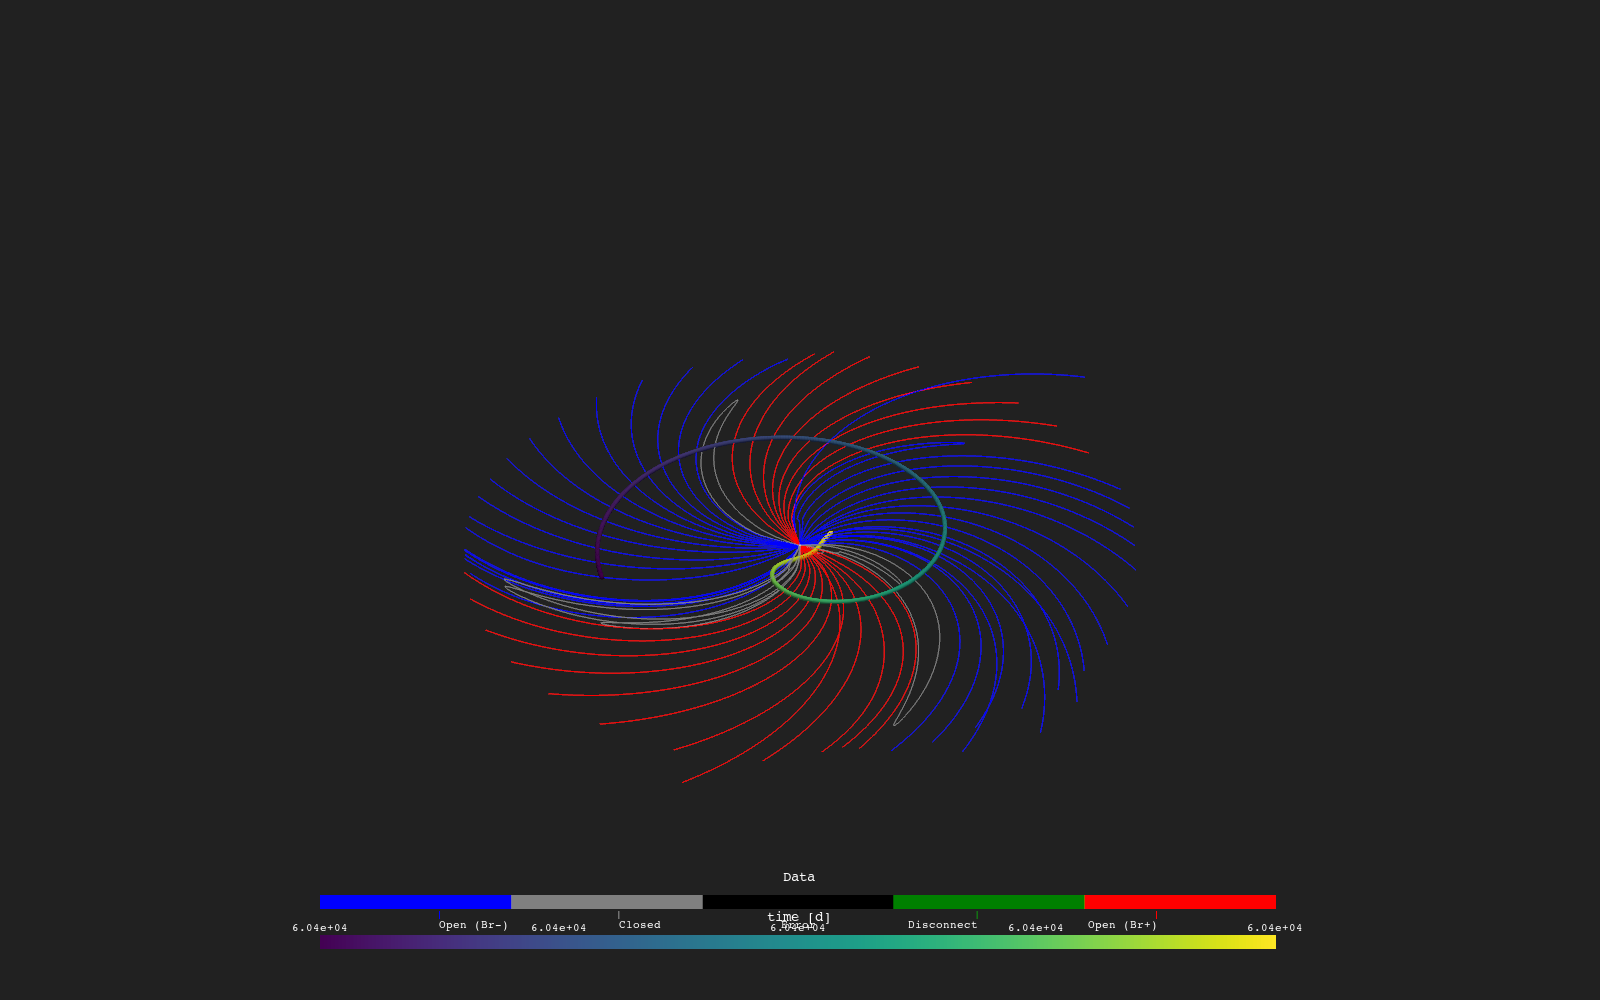
Spacecraft Launch Points turns a whole spacecraft orbit into a set of field-line launch points: PSP's March 2024 ephemeris (about 744 hourly points) is downsampled by a…
Table Time Series reads a table downloaded from the Time Series tool on MHDweb (https://predsci.com/mhdweb2/tools/time-series; see https://predsci.com/mhdweb2/about) str…
Click a point on the lower boundary of a time-dependent MAS run to place a wedge of launch points above it and trace the field lines through the eruption, each line in i…
Ephemeris Sync drives every time-dependent piece of this graph from one DateTime controller ("Time"): its exposed time port feeds the Eclipse Run reader (Time Mode By Ti…
Compares the endpoints of field lines traced at two consecutive steps of a time-dependent MAS run, with the launch points of the second trace displaced along the velocit…
Shared Controllers is a tour of parameter ports (the ⊕ pop-out each exposed: list below records): a handful of primitives each drive many consumers at once, instead of o…
Vector Field (B) promotes three separately-staggered scalar readers into one vector field: Vector Field merges the eclipse directory reader's br/bt/bp dots (one componen…
Reads the magnetic field components from one MAS File node on the psi-data-utils run source and merges them into a vector field grid.
Reads the current density components from one MAS File node on the psi-data-utils run source and merges them into a vector field grid.
Reads the magnetic field from one MAS File node on the psi-data-utils run source into a vector field and finds its magnetic null points, plotted as points.
Reads the velocity components from one MAS File node on the psi-data-utils run source and merges them into a vector field grid.
Click a field line to highlight it: a Pick Point holder feeds Nearest Element, which redraws the closest line thick and orange over the grey bundle.
Click on the surface to launch a field line from the picked point: a Pick Point holder feeds a two-way trace through a coronal Tracer.
Click on the current sheet to volume-render a cube of log temperature around the picked point.
Turns a run of clicks into a smooth curve: picks are collected in an Accumulator and upsampled into a spline.
A single Custom 3D File node for reading an HDF file of any layout; set its path, variable and scales.
Reads point geometry from an HDF file with a Geometry File node and plots it.
A single HDF 1D File node for reading one named coordinate axis from an HDF file.
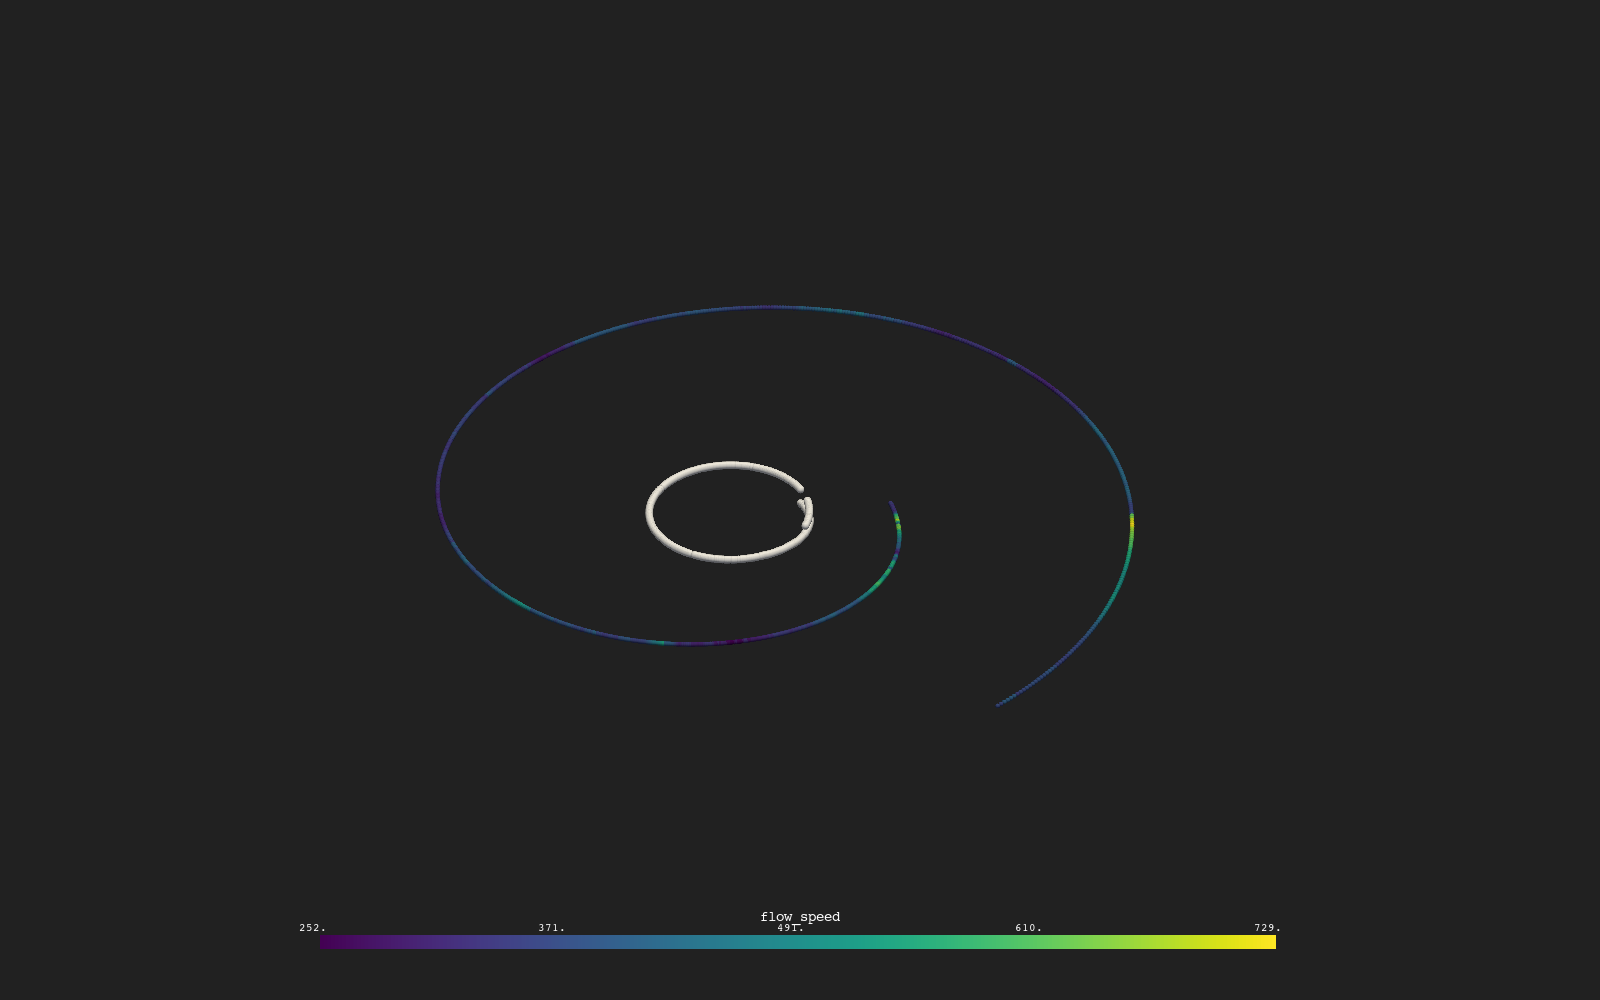
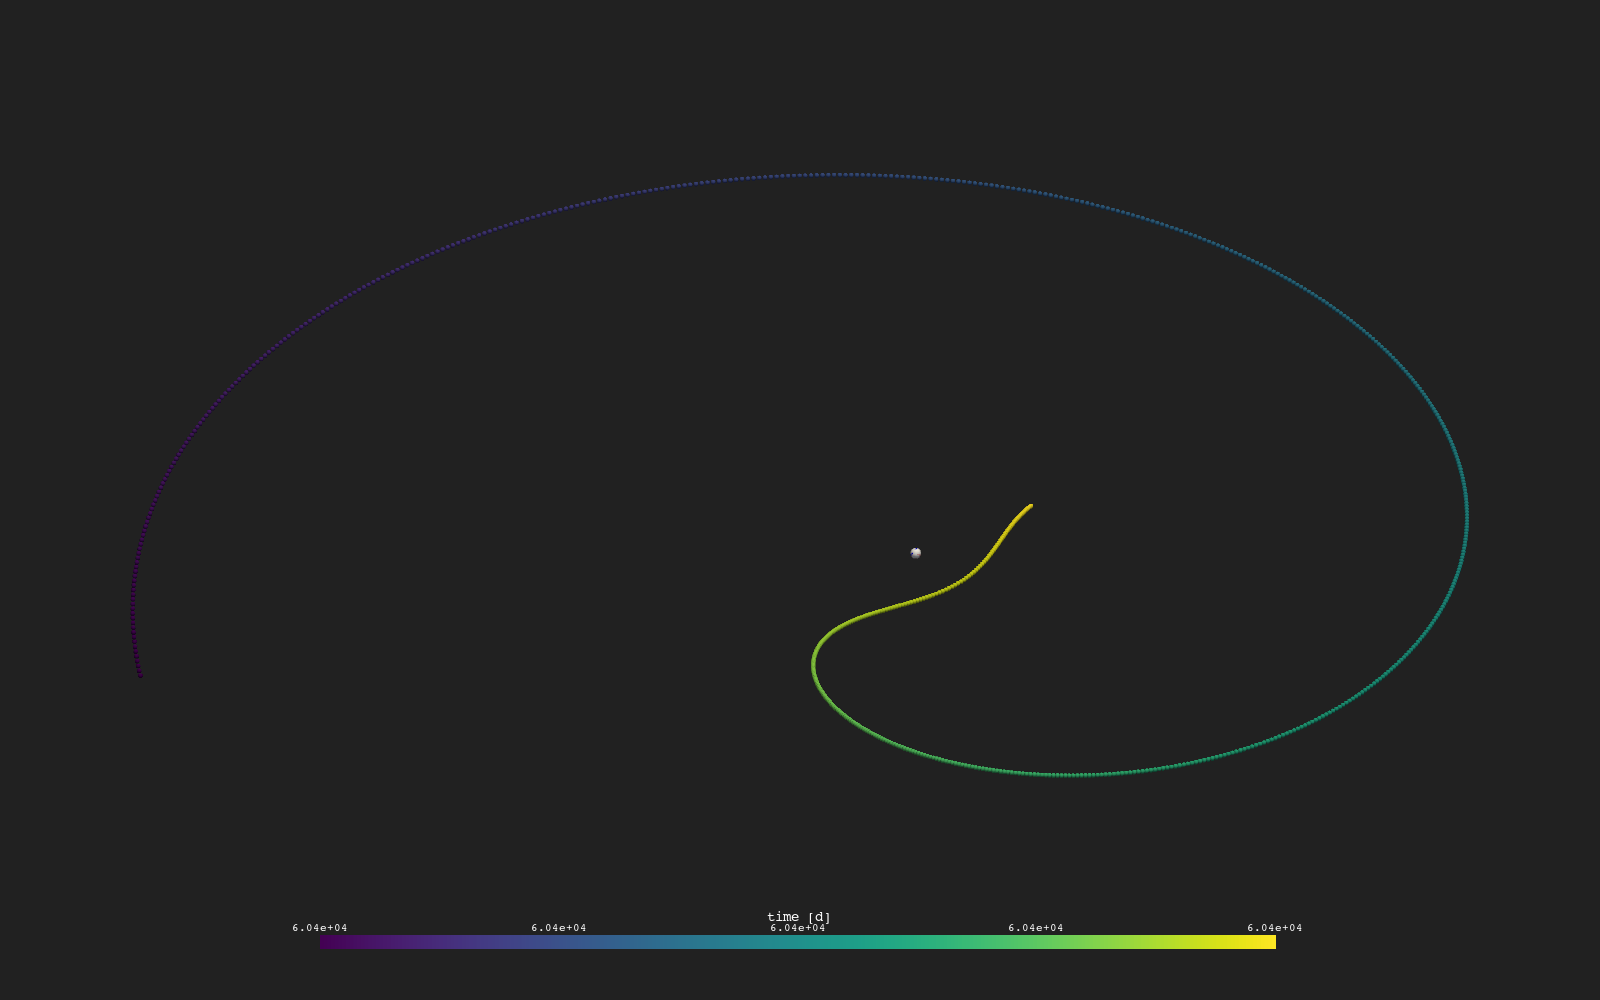
Fetches a spacecraft's trajectory and plots it as points colored by time.
Fetches a spacecraft's in situ measurements, such as the radial magnetic field, along its trajectory and plots them.
Plots the heliospheric current sheet as the surface where the radial magnetic field is zero.
Finds magnetic null points as the crossings of the Br, Bt and Bp zero isosurfaces.
Plots the current sheet and colors it by log density sampled from a second MAS file.
Draws the Thomson sphere for an observer position: the sphere whose diameter is the line from the Sun to the observer.
Traces field lines across the coronal and heliospheric domains with two Tracers joined at an interface radius.
Traces magnetic field lines against the field from launch points on a sphere, using a coronal Tracer.
Traces magnetic field lines in both directions from launch points on a sphere and joins them into whole lines.
Traces magnetic field lines along the field from launch points on a sphere, using a coronal Tracer.
Nothing matches. Clear the search to see everything.