 PVA
About PVA
PVA (PyVisual Application) is a desktop application for exploring three-dimensional simulation output on spherical grids.
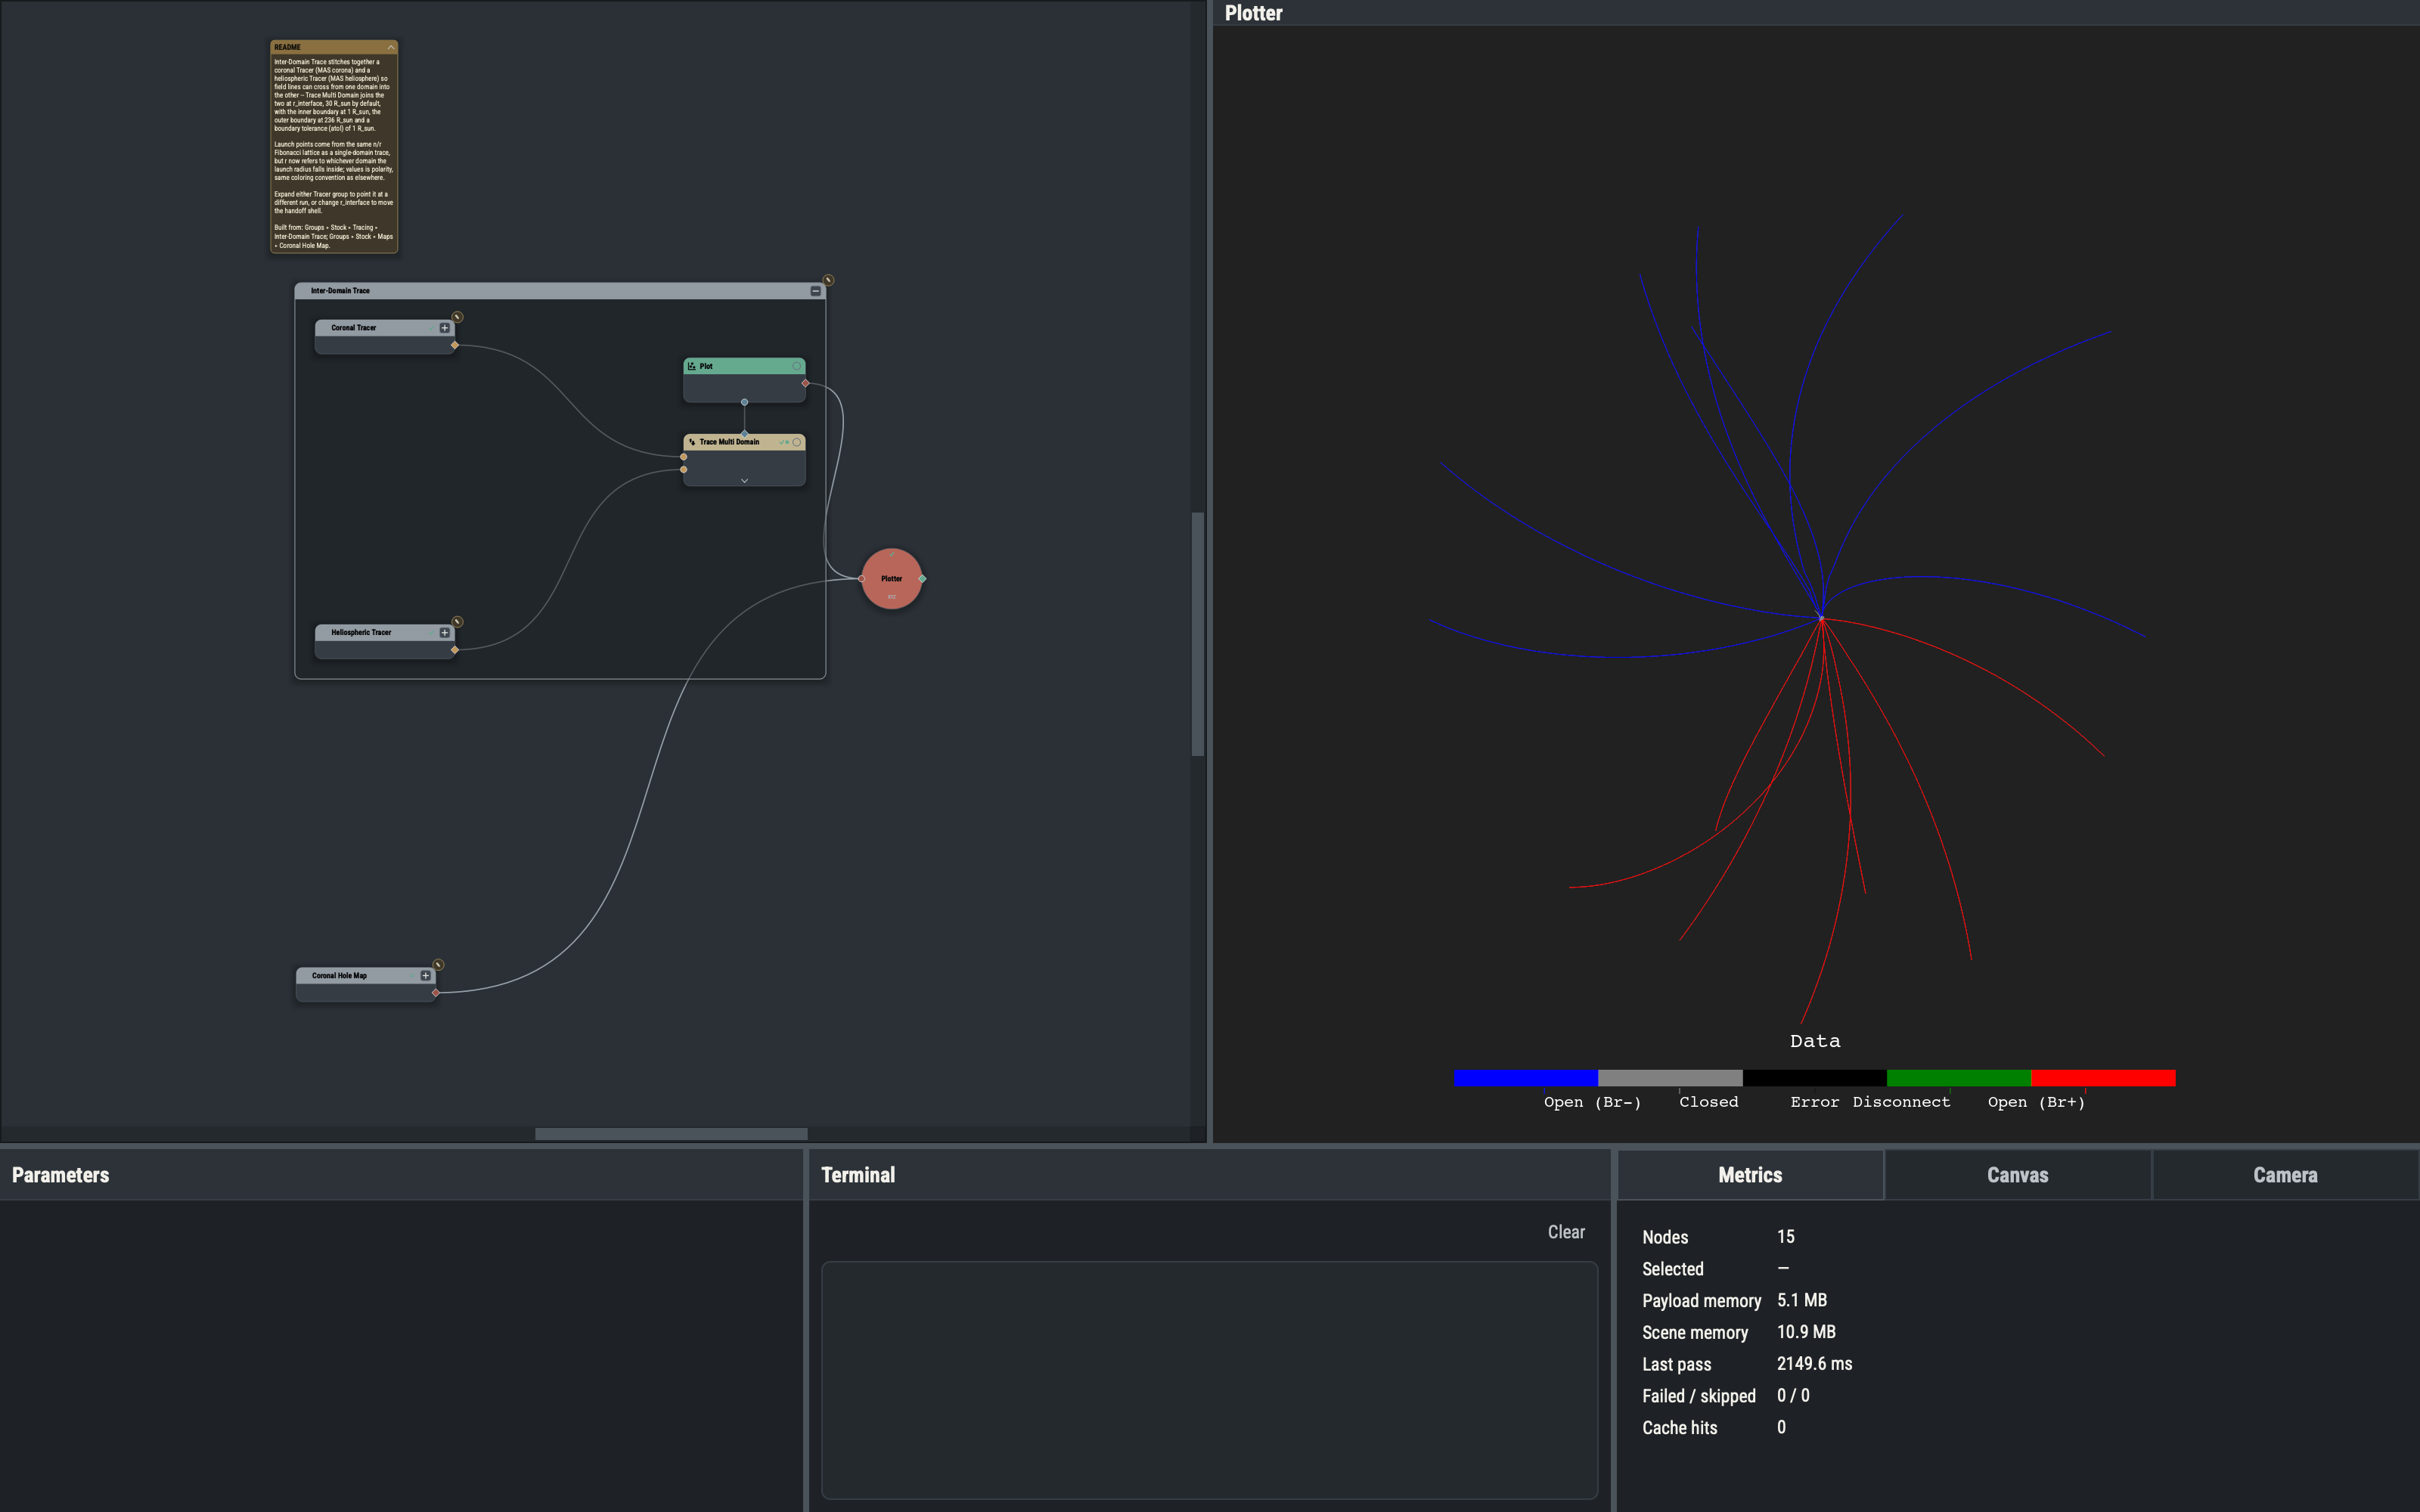
It is a node-graph front end over pyvisual, a thin layer on PyVista for data in spherical coordinates (radius, colatitude, longitude). Instead of writing a script, you build a graph: readers feed slices and filters, tracers follow magnetic field lines, and plot nodes send the results to a 3-D viewport. Change a parameter and only the affected part of the graph recomputes.
The application's Help menu has two entries: PyVisual Help opens this site's home page, and Report an Issue… opens the feedback tracker. File ▸ Browse Templates… opens the Templates page.
What it reads and draws
- Model output from MAS and POT3D, plus generic HDF4 and HDF5 files, tables and geometry files.
- Spacecraft ephemerides (through SunPy and JPL Horizons) and in situ measurements (through hapiclient and CDAWeb).
- Slices, isosurfaces, clipped and filtered meshes, vector fields and glyphs, volume patches.
- Field lines traced with the MAS tracer (mapflpy), including tracing across domains.
- Animations driven by parameters, rendered in the application or headless from the command line, and 3-D scenes exported as glTF.
Who makes it
PVA is developed by Predictive Science Inc. © 2026 Predictive Science Inc.. It is released under the Apache 2.0 license. This site documents version 1.12.0.
PSI Packages
| Package | Version | Role |
|---|---|---|
| psi-pyvisual [cite] | 1.0.3 | The pyvisual library: 3-D visualization of spherical-coordinate model output, built on PyVista. |
| psi-io [cite] | 2.2.1 | Reading and writing PSI's HDF4 and HDF5 data files, with interpolation helpers. |
| mapflpy [cite] | 1.2.1 | Python interface to the MAS field-line tracer, used by the Tracer nodes. |
| psi-data-utils [cite] | 1.0.0 | Downloads and caches the sample data sets used by the stock templates and the tutorial. |
Build Packages
| Package | Version | Role |
|---|---|---|
| PySide6 [cite] | 6.11.1 | Qt for Python: the application's windows, canvas and panes. |
| PyVista [cite] | 0.48.4 | The 3-D plotting layer over VTK. |
| pyvistaqt | 0.11.4 | Embeds PyVista plotters in Qt windows. |
| VTK [cite] | 9.6.2 | The visualization toolkit that renders every viewport. |
| NumPy [cite] | 2.5.2 | Array computation behind the function nodes. |
| SciPy [cite] | 1.18.0 | Interpolation and numerical routines. |
| Astropy [cite] | 8.0.0 | Units, quantities and table reading. |
| SunPy [cite] | 8.0.0 | Spacecraft ephemerides through JPL Horizons. |
| hapiclient [cite] | 0.2.6 | In situ spacecraft measurements from CDAWeb through the HAPI protocol. |
| pandas [cite] | 3.0.3 | Tabular data handling. |
| h5py [cite] | 3.16.0 | HDF5 file access. |
| pyhdf [cite] | 0.11.6 | HDF4 file access. |
| Matplotlib [cite] | 3.11.0 | Colormaps. |
| superqt [cite] | 0.8.2 | Extra Qt widgets such as range sliders. |
| qtawesome [cite] | 1.4.2 | The icon fonts used for node and menu icons. |
| cmap [cite] | 0.7.2 | Colormap catalog. |
| pooch [cite] | 1.9.0 | Data file fetching and caching. |
| PyYAML [cite] | 6.0.3 | Settings and session files. |
| psutil [cite] | 7.2.2 | Memory and CPU checks for animation rendering. |
| FFmpeg [cite] | 8.1.2 | Encodes animation frames into movies (LGPL 2.1 or later). |
| OpenH264 [cite] | 2.6.0 | The H.264 encoder (libopenh264) that FFmpeg uses by default. OpenH264 Video Codec provided by Cisco Systems, Inc. |
| imageio-ffmpeg | 0.6.0 | Fallback FFmpeg lookup. |
| PlasmaPy [cite] | Method reference for the Null Points node's trilinear null finder (plasmapy.analysis.nullpoint); not a runtime dependency. |
Citations
If you use PVA, please also cite the work behind the packages and models you rely on. Entries follow AGU style, alphabetical by first author.
- Astro contributors. (n.d.). Astro [Computer software]. The Astro Technology Company. Retrieved October 30, 2026, from https://astro.build/ This site.
- Astropy Collaboration, Robitaille, T. P., Tollerud, E. J., Greenfield, P., Droettboom, M., Bray, E., Aldcroft, T., Davis, M., Ginsburg, A., Price-Whelan, A. M., et al. (2013). Astropy: A community Python package for astronomy. Astronomy & Astrophysics, 558, A33. https://doi.org/10.1051/0004-6361/201322068 Units, quantities and table reading.
- Astropy Collaboration, Price-Whelan, A. M., Sipőcz, B. M., Günther, H. M., Lim, P. L., Crawford, S. M., Conseil, S., Shupe, D. L., Craig, M. W., Dencheva, N., et al. (2018). The Astropy Project: Building an Open-science Project and Status of the v2.0 Core Package. The Astronomical Journal, 156(3), 123. https://doi.org/10.3847/1538-3881/aabc4f Units, quantities and table reading.
- Astropy Collaboration, Price-Whelan, A. M., Lim, P. L., Earl, N., Starkman, N., Bradley, L., Shupe, D. L., Patil, A. A., Corrales, L., Brasseur, C. E., et al. (2022). The Astropy Project: Sustaining and Growing a Community-oriented Open-source Project and the Latest Major Release (v5.0) of the Core Package. The Astrophysical Journal, 935(2), 167. https://doi.org/10.3847/1538-4357/ac7c74 Units, quantities and table reading.
- Caplan, R. M., Downs, C., Linker, J. A., & Mikić, Z. (2021). Variations in Finite-difference Potential Fields. The Astrophysical Journal, 915(1), 44. https://doi.org/10.3847/1538-4357/abfd2f The POT3D potential-field solver whose output PVA reads.
- Cisco Systems, Inc. (n.d.). OpenH264 [Computer software]. Retrieved October 30, 2026, from https://www.openh264.org/ The H.264 encoder (libopenh264) FFmpeg uses by default.
- Collette, A. (2013). Python and HDF5. O'Reilly Media. ISBN 978-1-4493-6783-1. HDF5 file access.
- conda-forge community. (2015). The conda-forge Project: Community-based Software Distribution Built on the conda Package Format and Ecosystem [Computer software]. Zenodo. https://doi.org/10.5281/zenodo.4774216 The environment the installers are frozen from.
- Corlay, S., & Spyder Development Team. (2026). QtAwesome (Version 1.4.2) [Computer software]. https://pypi.org/project/QtAwesome/ Node and menu icons.
- FFmpeg developers. (n.d.). FFmpeg [Computer software]. Retrieved October 30, 2026, from https://ffmpeg.org/ Encodes animation frames into movies (LGPL build).
- Ginsburg, A., Sipőcz, B. M., Brasseur, C. E., Cowperthwaite, P. S., Craig, M. W., Deil, C., Guillochon, J., Guzman, G., Liedtke, S., Lim, P. L., et al. (2019). astroquery: An Astronomical Web-querying Package in Python. The Astronomical Journal, 157(3), 98. https://doi.org/10.3847/1538-3881/aafc33 The Horizons query that SunPy uses for spacecraft ephemerides.
- Giorgini, J. D., Yeomans, D. K., Chamberlin, A. B., Chodas, P. W., Jacobson, R. A., Keesey, M. S., Lieske, J. H., Ostro, S. J., Standish, E. M., & Wimberly, R. N. (1996). JPL's on-line solar system data service. Bulletin of the American Astronomical Society, 28(3), 1158. https://ssd.jpl.nasa.gov/horizons/ Spacecraft ephemerides from the JPL Horizons system.
- Giorgini, J. D., & JPL Solar System Dynamics Group. (n.d.). NASA/JPL Horizons On-Line Ephemeris System [Online ephemeris service]. NASA Jet Propulsion Laboratory. Retrieved October 30, 2026, from https://ssd.jpl.nasa.gov/horizons/ Spacecraft ephemerides (cite with the date the data were retrieved).
- Gosselin, A., et al. (n.d.). pyhdf [Computer software]. Retrieved October 30, 2026, from https://pypi.org/project/pyhdf/ HDF4 file access.
- Harris, C. R., Millman, K. J., van der Walt, S. J., Gommers, R., Virtanen, P., Cournapeau, D., Wieser, E., Taylor, J., Berg, S., Smith, N. J., et al. (2020). Array programming with NumPy. Nature, 585(7825), 357–362. https://doi.org/10.1038/s41586-020-2649-2 Array computation behind the function nodes.
- Haynes, A. L., & Parnell, C. E. (2007). A trilinear method for finding null points in a three-dimensional vector space. Physics of Plasmas, 14(8), 082107. https://doi.org/10.1063/1.2756751 The trilinear method the Null Points node follows.
- Hunter, J. D. (2007). Matplotlib: A 2D Graphics Environment. Computing in Science & Engineering, 9(3), 90–95. https://doi.org/10.1109/MCSE.2007.55 Colormaps.
- Lambert, T. (2026). cmap (Version 0.7.2) [Computer software]. https://pypi.org/project/cmap/ Colormap catalog.
- Lionello, R., Linker, J. A., & Mikić, Z. (2009). Multispectral emission of the Sun during the first Whole Sun Month: Magnetohydrodynamic simulations. The Astrophysical Journal, 690(1), 902–912. https://doi.org/10.1088/0004-637X/690/1/902 The MAS model whose output PVA reads.
- Mikić, Z., Linker, J. A., Schnack, D. D., Lionello, R., & Tarditi, A. (1999). Magnetohydrodynamic modeling of the global solar corona. Physics of Plasmas, 6(5), 2217–2224. https://doi.org/10.1063/1.873474 The MAS model whose output PVA reads.
- NASA Space Physics Data Facility. (2012). Space Physics Data Facility (SPDF) [Data facility]. Registry of Research Data Repositories (re3data.org). https://doi.org/10.17616/R3P301 CDAWeb and COHOWeb in situ spacecraft data. The SPDF asks that the service be cited as 'NASA Space Physics Data Facility (SPDF); Registry of Research Data Repositories (re3data.org)', followed by the date accessed.
- pandas development team. (n.d.). pandas [Computer software]. Retrieved October 30, 2026, from https://pandas.pydata.org/ Tabular data handling.
- Papitashvili, N. E., & King, J. H. (2020). OMNI Combined Heliospheric Observations (COHO), Merged Magnetic Field, Plasma and Ephemeris, Definitive Hourly Data [Data set]. Space Physics Data Facility. https://doi.org/10.48322/6ffx-3441 The COHO hourly merged data set (*_COHO1HR_MERGED_MAG_PLASMA) that the in situ spacecraft readers use.
- Parnell, C. E., Smith, J. M., Neukirch, T., & Priest, E. R. (1996). The structure of three-dimensional magnetic neutral points. Physics of Plasmas, 3(3), 759–770. https://doi.org/10.1063/1.871810 Null-point classification (type, spine, fan) in the Null Points node.
- PlasmaPy Community, et al. (2026). PlasmaPy (Version 2026.2.0) [Computer software]. Zenodo. https://doi.org/10.5281/zenodo.18706665 Reference implementation of the null-point finder (plasmapy.analysis.nullpoint) that the Null Points node follows; a method reference, not a dependency.
- Predictive Science Inc. (2026). mapflpy (Version 1.2.1) [Computer software]. https://pypi.org/project/mapflpy/ The MAS field-line tracer used by the Tracer nodes.
- Predictive Science Inc. (2026). psi-data-utils (Version 1.0.0) [Computer software]. https://pypi.org/project/psi-data-utils/ Downloads and caches the sample data sets.
- Predictive Science Inc. (2026). psi-io (Version 2.2.1) [Computer software]. https://pypi.org/project/psi-io/ Reading and writing PSI's HDF4 and HDF5 data files.
- Predictive Science Inc. (2026). psi-pyvisual (Version 1.0.3) [Computer software]. https://pypi.org/project/psi-pyvisual/ The pyvisual library under PVA.
- PyInstaller Development Team. (n.d.). PyInstaller [Computer software]. Retrieved October 30, 2026, from https://pyinstaller.org/ Freezes the installers.
- Rodola, G. (n.d.). psutil [Computer software]. Retrieved October 30, 2026, from https://pypi.org/project/psutil/ Memory and CPU checks for animation rendering.
- Schroeder, W., Martin, K., & Lorensen, B. (2006). The Visualization Toolkit: An object-oriented approach to 3D graphics (4th ed.). Kitware. ISBN 978-1-930934-19-1. The visualization toolkit that renders every viewport.
- Simonov, K. (n.d.). PyYAML [Computer software]. Retrieved October 30, 2026, from https://pyyaml.org/ Settings and session files.
- Sullivan, C., & Kaszynski, A. (2019). PyVista: 3D plotting and mesh analysis through a streamlined interface for the Visualization Toolkit (VTK). Journal of Open Source Software, 4(37), 1450. https://doi.org/10.21105/joss.01450 The 3-D plotting layer over VTK.
- SunPy Community, Barnes, W. T., Bobra, M. G., Christe, S. D., Freij, N., Hayes, L. A., Ireland, J., Mumford, S., Perez-Suarez, D., Ryan, D. F., et al. (2020). The SunPy Project: Open Source Development and Status of the Version 1.0 Core Package. The Astrophysical Journal, 890(1), 68. https://doi.org/10.3847/1538-4357/ab4f7a Spacecraft ephemerides through JPL Horizons.
- superqt community. (2026). superqt (Version 0.8.2) [Computer software]. pyapp-kit. https://pypi.org/project/superqt/ Extra Qt widgets such as range sliders.
- The Qt Company. (2026). Qt for Python (PySide6) (Version 6.11.1) [Computer software]. https://pypi.org/project/PySide6/ The application's windows, canvas and panes.
- three.js authors. (n.d.). three.js [Computer software]. Retrieved October 30, 2026, from https://threejs.org/ This site's 3-D scene viewer.
- Uieda, L., Soler, S., Rampin, R., van Kemenade, H., Turk, M., Shapero, D., Banihirwe, A., & Leeman, J. (2020). Pooch: A friend to fetch your data files. Journal of Open Source Software, 5(45), 1943. https://doi.org/10.21105/joss.01943 Data file fetching and caching.
- Virtanen, P., Gommers, R., Oliphant, T. E., Haberland, M., Reddy, T., Cournapeau, D., Burovski, E., Peterson, P., Weckesser, W., Bright, J., et al. (2020). SciPy 1.0: fundamental algorithms for scientific computing in Python. Nature Methods, 17(3), 261–272. https://doi.org/10.1038/s41592-019-0686-2 Interpolation and numerical routines.
- Weigel, R. S., Vandegriff, J., Faden, J., King, T., Roberts, D. A., Harris, B., Candey, R., Lal, N., Boardsen, S., Lindholm, C., et al. (2021). HAPI: An API Standard for Accessing Heliophysics Time Series Data. Journal of Geophysical Research: Space Physics, 126(12), e2021JA029534. https://doi.org/10.1029/2021JA029534 The HAPI protocol behind the in situ spacecraft readers.
- Weigel, R. S. (2024). hapiclient (Version 0.2.6) [Computer software]. hapi-server. https://pypi.org/project/hapiclient/ In situ spacecraft measurements through the HAPI protocol.
Acknowledgment text
The data services ask for the following wording in publications that use their data.
- NASA GSFC SPDF (CDAWeb, COHOWeb). We acknowledge use of NASA/GSFC's Space Physics Data Facility's CDAWeb service. Each in situ data set also has its own principal-investigator citation, listed on CDAWeb and in the data set documentation. The SPDF's own wording names OMNIWeb, CDAWeb or ftp as the service used. Source
- NASA/JPL Horizons. Giorgini, JD and JPL Solar System Dynamics Group, NASA/JPL Horizons On-Line Ephemeris System, <https://ssd.jpl.nasa.gov/horizons/>, data retrieved YYYY-MON-DD. The Horizons documentation gives this reference form rather than an acknowledgment sentence; replace YYYY-MON-DD with the retrieval date. Source
- MAS and POT3D model output. Results that use MAS or POT3D output should cite the model papers listed above (Mikić et al., 1999; Lionello et al., 2009; Caplan et al., 2021).