
Lyme Disease
Lyme Disease
Lyme Disease is the result of tick-borne bacteria from the Borrelia genus. A documented outbreak in Lyme, Connecticut during the 1960's and 1970's led scientists, including Dr Willy Burgdorfer, to connect the disease to deer ticks and a specific bacterium, later named Borrelia bergdorferi. Today, Lyme disease is one of the fastest growing vector-borne infections in the United States. Although treatable with antibiotics, early detection and treatment provide the best chance of a complete recovery. However, early diagnoses continues to be challenging because symptoms often mimic other diseases and testing is more effective in late disease. For these reasons, it is important to alert local physicians when Lyme disease prevalence is on the rise or projected to rise.
Our Contribution
Data for Lyme disease is limited. The CDC maintains a database of yearly numbers (https://www.cdc.gov/lyme/stats/index.html); however, more temporally-resolved data are only available in PDF format in the form of histograms.
Figure 1: Aggregated, confirmed Lyme disease cases by month of disease onset for USA (2001 through 2016). Figure from CDC https://www.cdc.gov/lyme/stats/graphs.html
As the plot above demonstrates, Lyme disease tends to explode rapidly in late spring, peaking in July, and returning to baseline levels by late November. To explore the dynamics of this pattern in more detail, we developed a profile for an "average" year by digitizing these numbers and dividing by the total number of years used to make each bar. We then ran our fitting code using a compartmental S-I-R model and a selection of values for the generation time, Tg ranging from 3 to 18 days. It is worth noting that although this is only a subset of the actual number of cases (by a factor of 10 or more as explained below), since our model includes a parameter, pC, which is the fraction of total cases that is reported to a clinic, this connects the confirmed Lyme disease cases with the expected total number. Although good fits were found for all possible values of the generation time, AICc scores suggested that the longer-time-scale values were better (9-18 days).
The close match between model and observations demonstrates that even a simple application of the our model can result in reasonable inferences. However, from both a scientific and societal perspective, a more important question concerns the reason behind the dramatic increase in the number of cases over the past 25 years. A recent NY Times article (https://www.nytimes.com/2018/05/01/health/ticks-mosquitoes-diseases.html) quoted researchers proposing several possible factors. Two are related to weather: ticks are now spreading into regions previously too cold for them. Additionally, there is an increase in the number of animal hosts that the ticks require. These could have been driven by a decrease in deer hunting and the disappearance of rodent predators like foxes. Finally, forests in suburbs in the Northeast appear to be getting thicker.
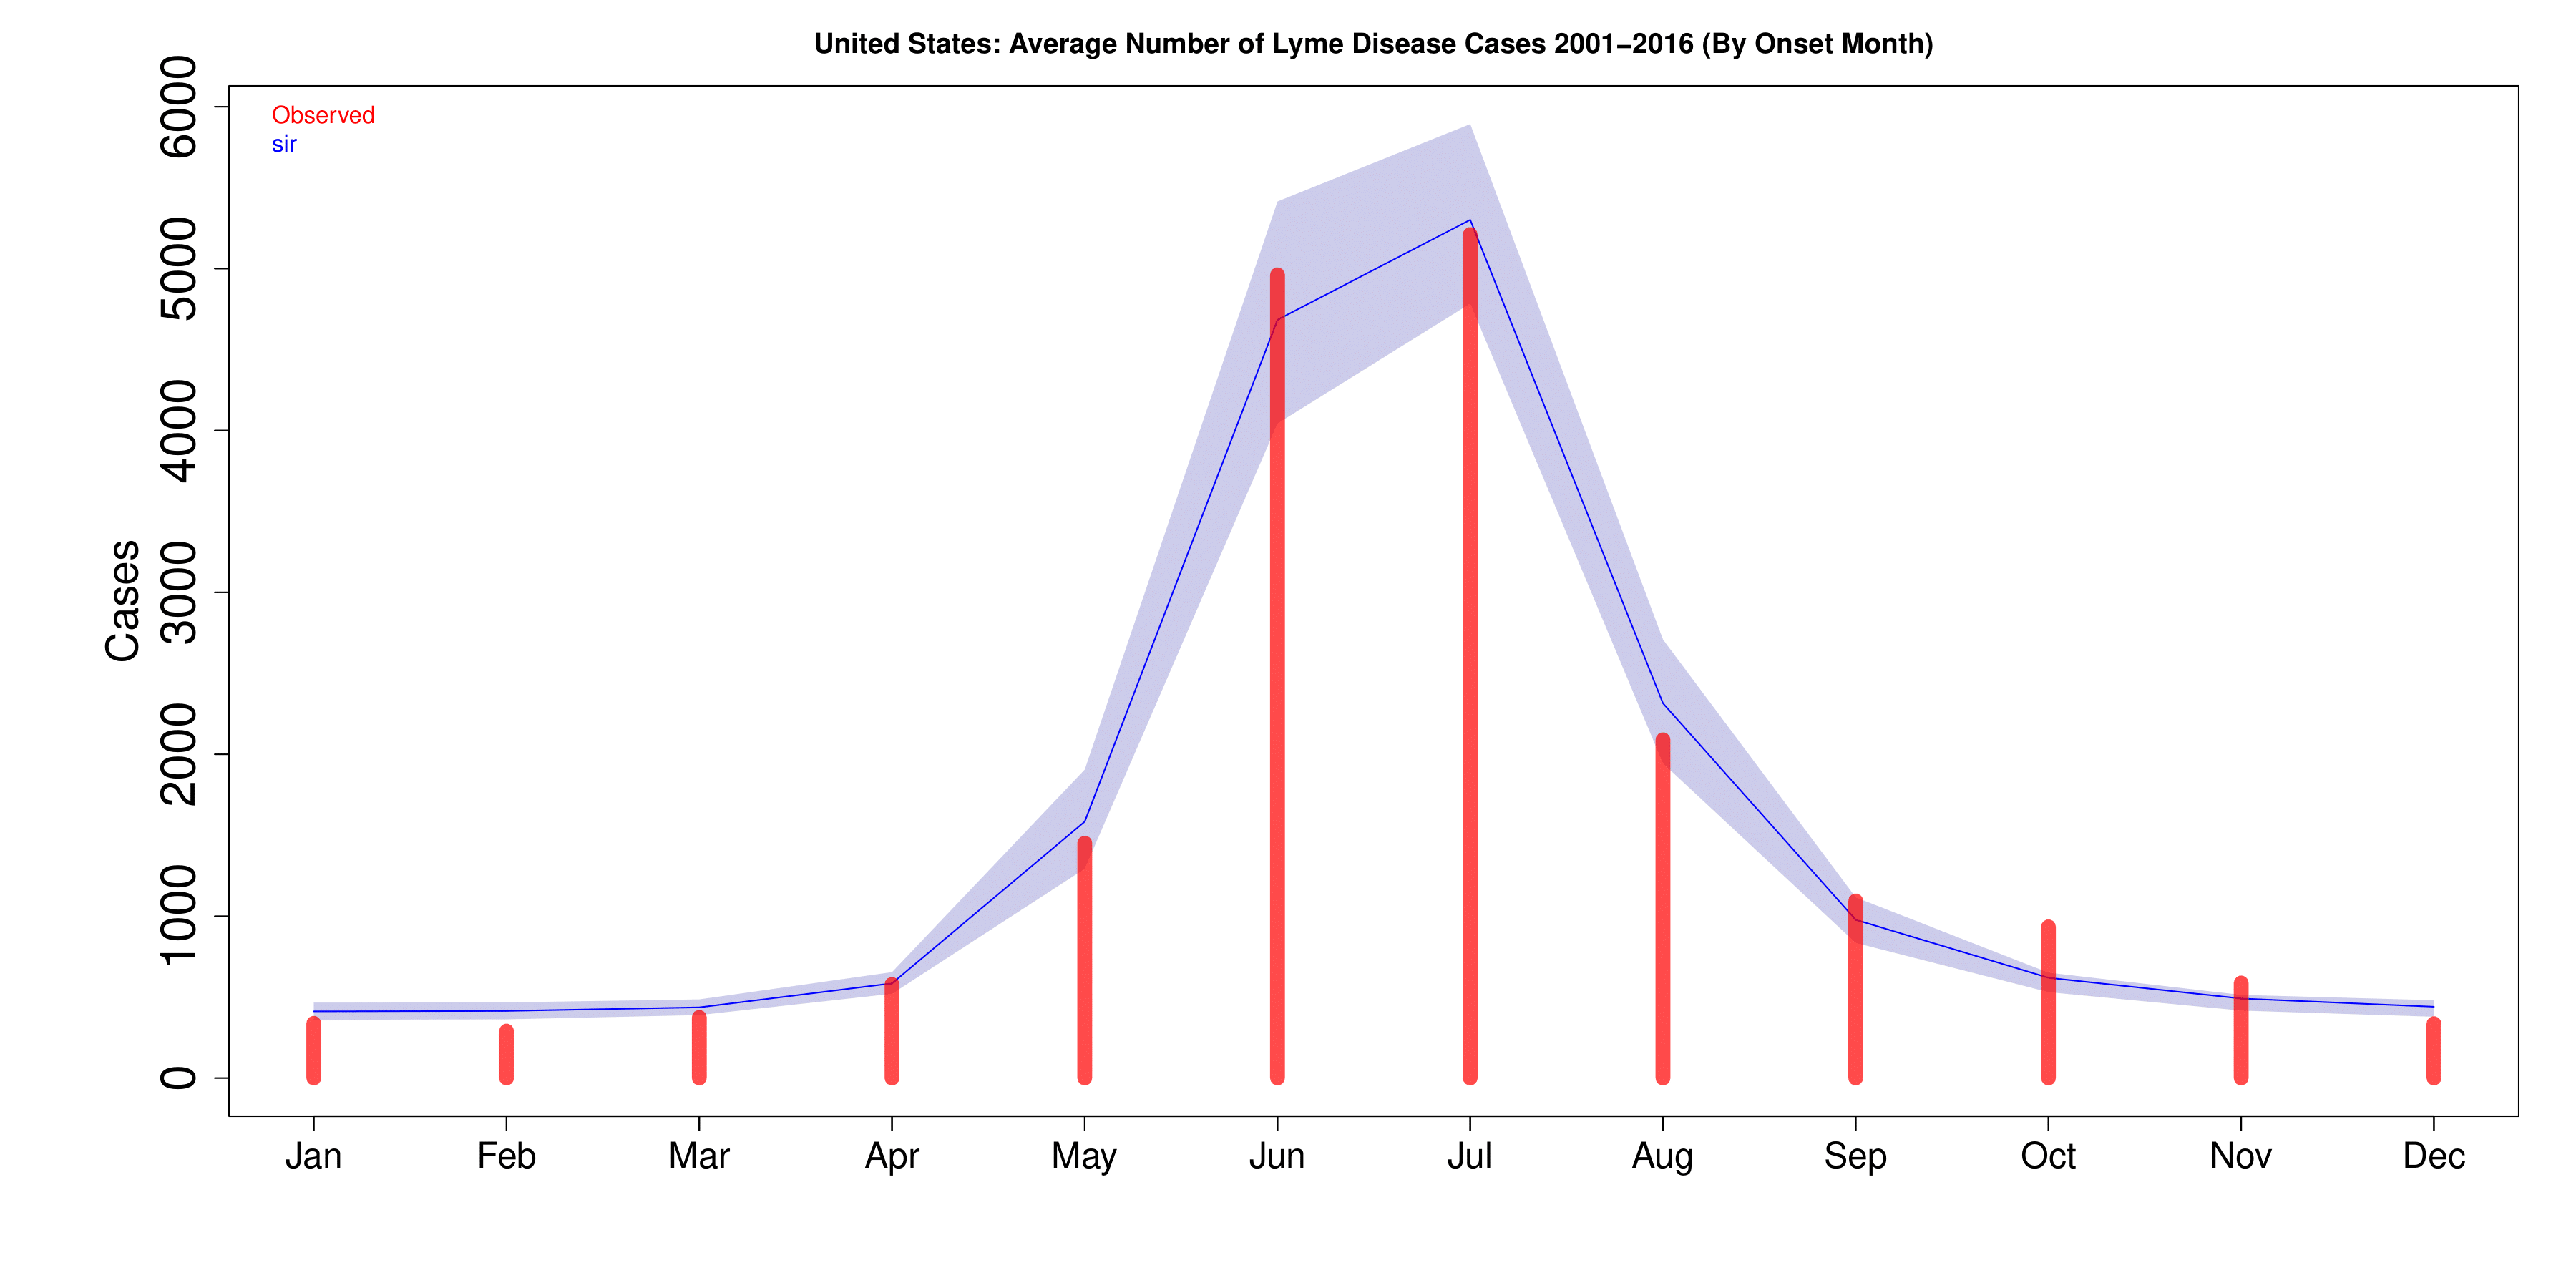
Figure 2: Average Lyme disease profile based on aggregated data from the CDC (red bars). The fit is shown by the blue line and 5/95% confidence intervals are marked by the purple region.
Data
In the US, health care providers and laboratories report possible cases of Lyme disease to state and local health department which investigate them and send the reports of confirmed and probable cases to the CDC. Depending on available resources, the extent of these investigations varies from state to state. Between 1991 to 2015 this number has increased from 10,000 a year to over 35,000. The CDC estimates that these reported numbers are not the actual number of Lyme disease cases diagnosed in the US every year. Based on standard national surveillance, which tracks where a disease is occurring and with what frequency, it is estimated that the true number of cases each year may be as high as 300,000. For data and information on Lyme disease in the USA see: https://www.cdc.gov/lyme/index.html.
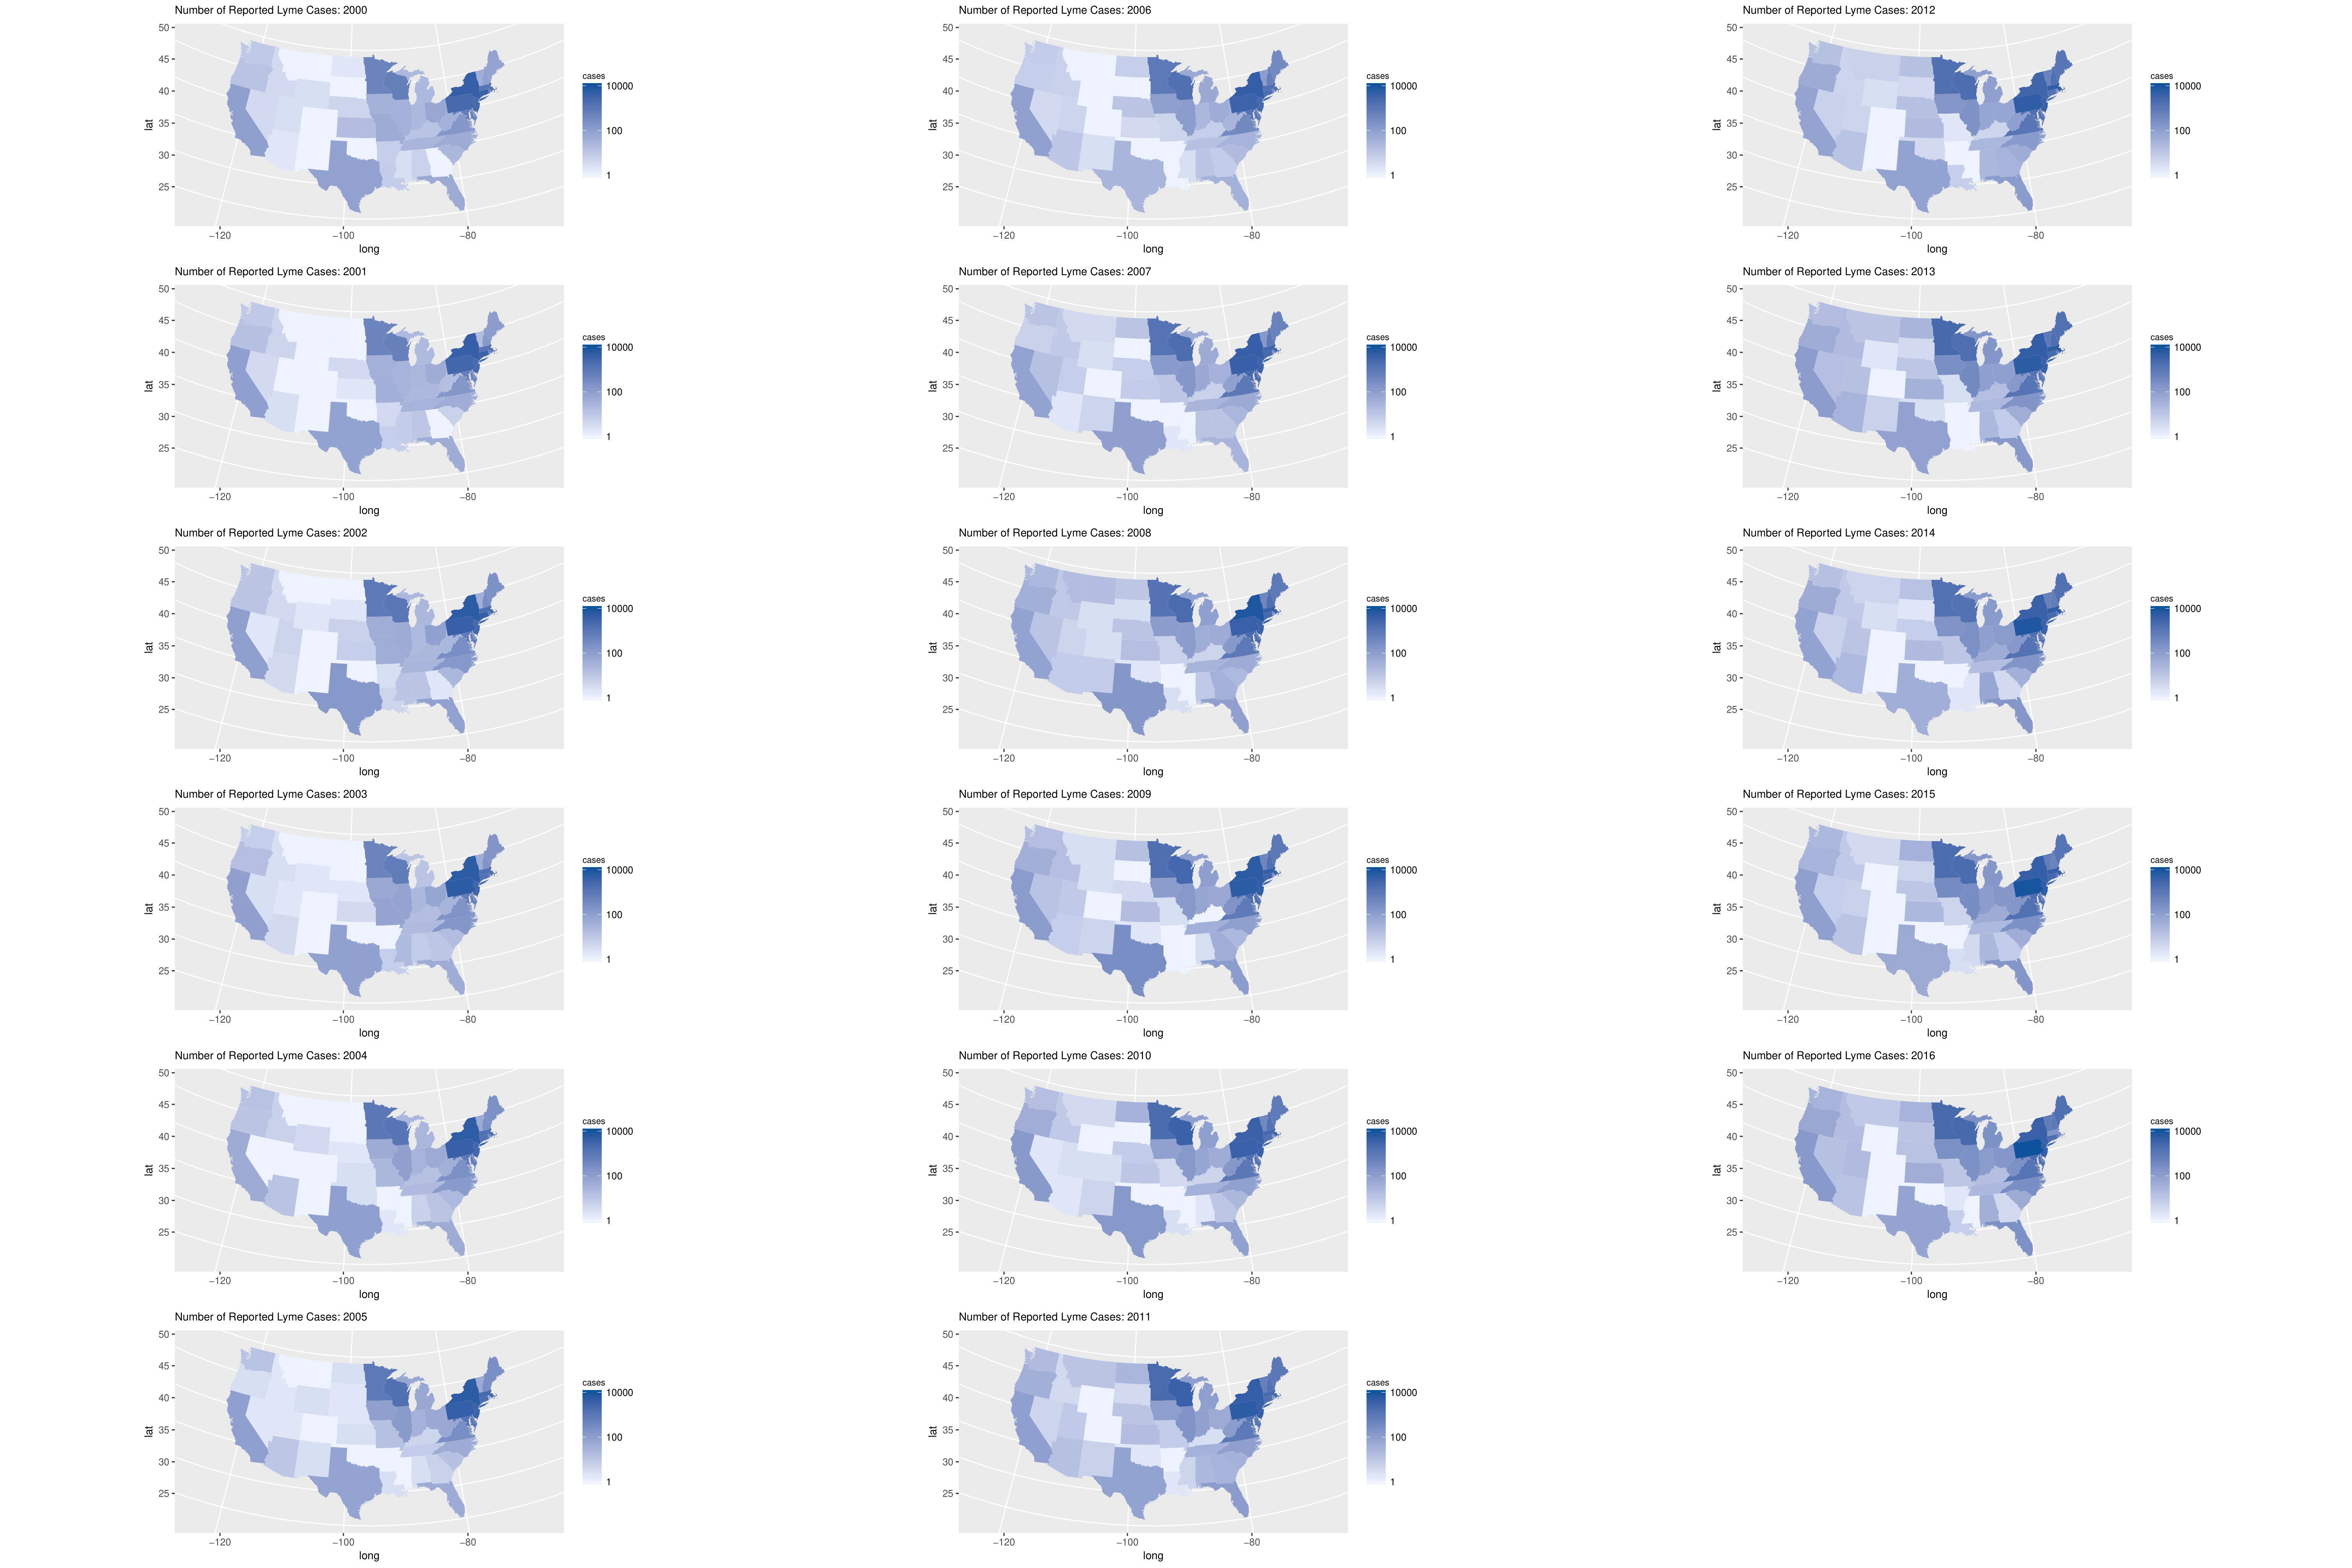
The heat maps below show the annual reported number of cases for each state in the continental US starting from 2000 (top left) and ending in 2016 (bottom right). These maps show that Lyme disease cases are concentrated in the Northeast and upper Midwest, with 14 states accounting for over 96% of cases reported to the CDC.
Future Plans
Currently, our team is re-focusing its efforts on better understanding the spread and severity of COVID-19, using the lessons learnt from influenza forecasting. However, given that weekly data sets for Lyme disease have been recently published by the CDC, we may revise our calculations.