
Zika
Zika
Zika fever is a disease caused by the mosquito-borne Zika virus. Known for sometimes causing microcephaly or Guillain-Barre Syndrome, the virus was discovered circa 1947 in the Zika Forest of Uganda. Previously found only in Africa and Southeast Asia, in 2007 an outbreak was discovered in the Yap Islands of Micronesia. Then over a two-year period (2013-2014) multiple outbreaks emerged across Oceania. These island infections were the first evidence that Zika was crossing to new continents. It is estimated that Zika first arrived in Brazil in 2013, leading to a large outbreak in 2015 that peaked in 2016. The 2015-16 outbreak in Brazil led to 1,950 cases of infection-related microcephaly and ultimately spread through most of the Americas. The most common vector for Zika is the Aedes Aegytpi mosquito, although Aedes Albopictus is also responsible for some transmission.
Our Contribution
We surveyed all available Zika data for the most promising incidence profiles and selected a subset of countries with the most reliable data. For these countries, we applied an SEIR model to estimate the basic transmission dynamics within each country. We used a generation time (Tg) of 7 days, which is reasonable based on published studies. While we found interesting differences in the estimated value for the basic reproduction number (R0) for each country, the fits were surprisingly good in almost all cases. Sometimes, however, it was clear that the country data was an aggregate of multiple curves, with different onset times and peaks. Thus, applying a single SEIR model to these would, at best, only produce an “effective” R0 estimate, but one that did not capture the underlying dynamics in each region. This is, we believe a fundamental, and under-appreciated facet of dynamical modeling of diseases where large spatial areas are aggregated. This is also an effect that can be addressed using our arbitrary spatial resolution code DICE.
Below we show a comparison of the SEIR model results with data from Puerto Rico. We note several points. First, the peak incidence reaches a substantial value of 2500 cases per week. Second, the SEIR model captures the development, peak, and decay of the epidemic remarkably well. The estimated R0 for Puerto Rico was 4.5 ± 0.5. This can be contrasted with a value of 7.0 ± 0.1 for Mexico, and 3.0 ± 0.2 for Nicaragua, although in latter case, the SEIR model did not reproduce the observations as well as was the case for Puerto Rico, and, as such, may have underestimated the true value of R0.
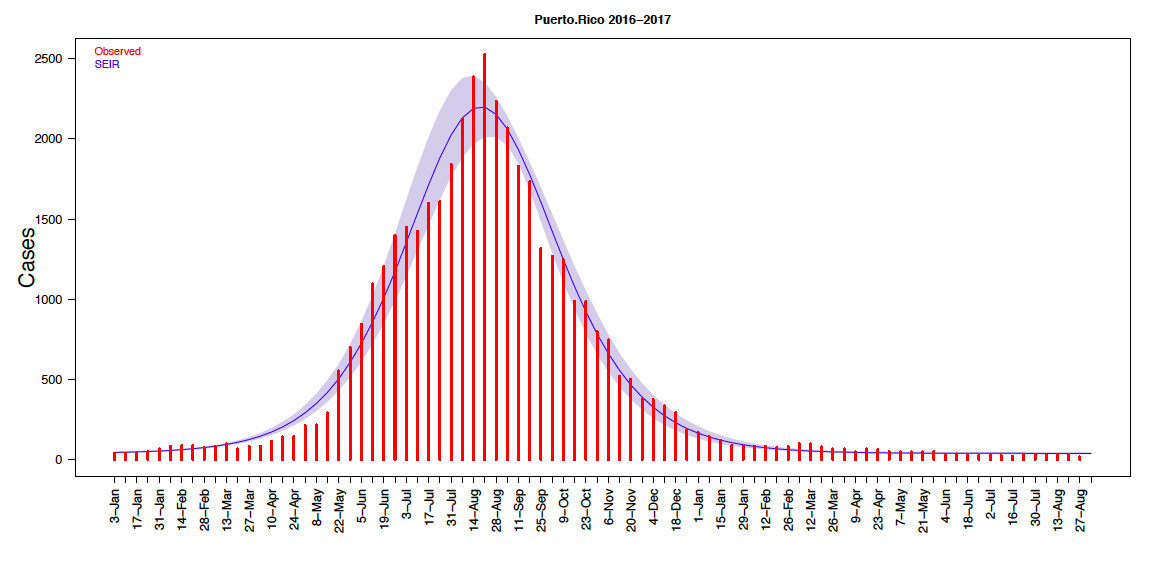
Figure 1: Number of cases and model fit for Puerto Rico spanning 2016 through 2017.
Data
Weekly case totals for South and Central American countries are available at:
http://www.predsci.com/id_data/
Data can be viewed, analyzed, and downloaded from this portal.
The data is primarily sourced from Pan American Health Organization reports.
Future Plans
Currently, our team is re-focusing its efforts on better understanding the spread and severity of COVID-19, and we have no plans to study Zika transmission at the present.