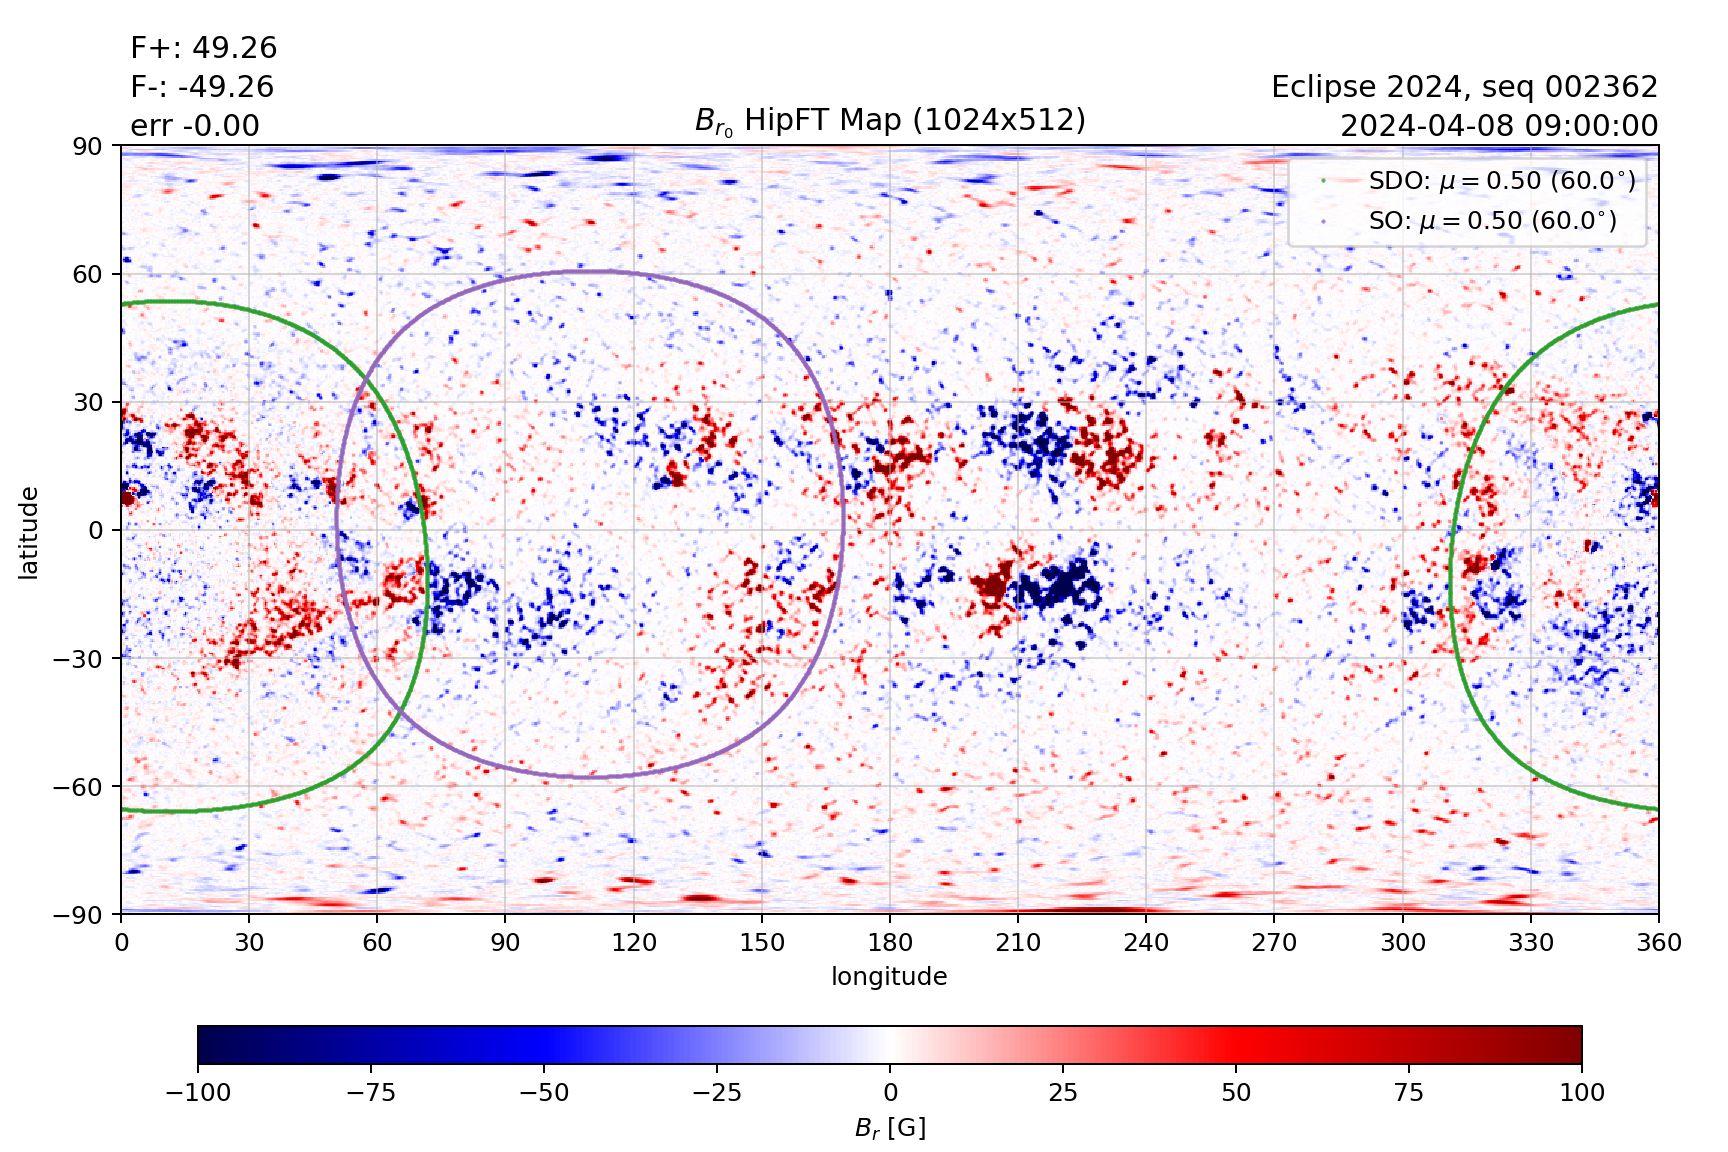
HipFT model result
(SDO assimilation region plus later SO view and assimilated regions are indicated)

SO/Metis
K-Corona Brightness, Radially Filtered
HipFT model result
(SDO assimilation region plus later SO view and assimilated regions are indicated)
SO/Metis
K-Corona Brightness, Radially Filtered
HipFT model result
(SDO assimilation region plus later SO view and assimilated regions are indicated)
SO/Metis
K-Corona Brightness, Radially Filtered
Another exciting element of the 2024 eclipse is the fact that the weeks leading up to totality coincide with a perihelion ESA's Solar Orbiter spacecraft (SO). During this time, SO will pass within 0.3 AU of the Sun, and it's view of the solar surface will change rapidly, allowing us to see parts of the Sun that aren't visible from the Sun-Earth line. Thanks to coordination with the team operating the SO PHI instrument, which includes a full-disk vector magnetograph (FDT), we have now incorporated snapshots of almost real-time SO/PHI-FDT observations into the model.
In the selected animations above we show the period from March 30th to now. On the left are snapshots of the data-assimilative HipFT run that powers the model. The green and purple circles indicate the ±60° field-of-view from SDO and SO respectively. As time progresses the SO view shifts away from SDO towards the west limb as seen from Earth. Beginning in April, we began assimilating snapshots of PHI-FDT measurements in regions that had evolved but were no longer well-observed by SDO/HMI. The black boxes that briefly appear indicate when and where PHI-FDT data is brought slowly into the model. Such a real-time assimilation of magnetic data off of the Sun-Earth line has not been attempted before, but is essential for capturing new flux emergence that will influence the structure of the corona. Most fortuitously, SO will have a perfect view of the surface beneath the West (right) limb of the corona on eclipse day.
Lastly, the right panel shows the unique view of the corona from the SO/Metis coronagraph. The white circle indicates the solar surface. As time progresses we see how SO is getting closer and then farther away from the Sun along the orbit. Most interestingly, as SO/Metis gets close, we begin to see different dynamic features in this “zoomed in view” compared to existing coronagraphs in space.