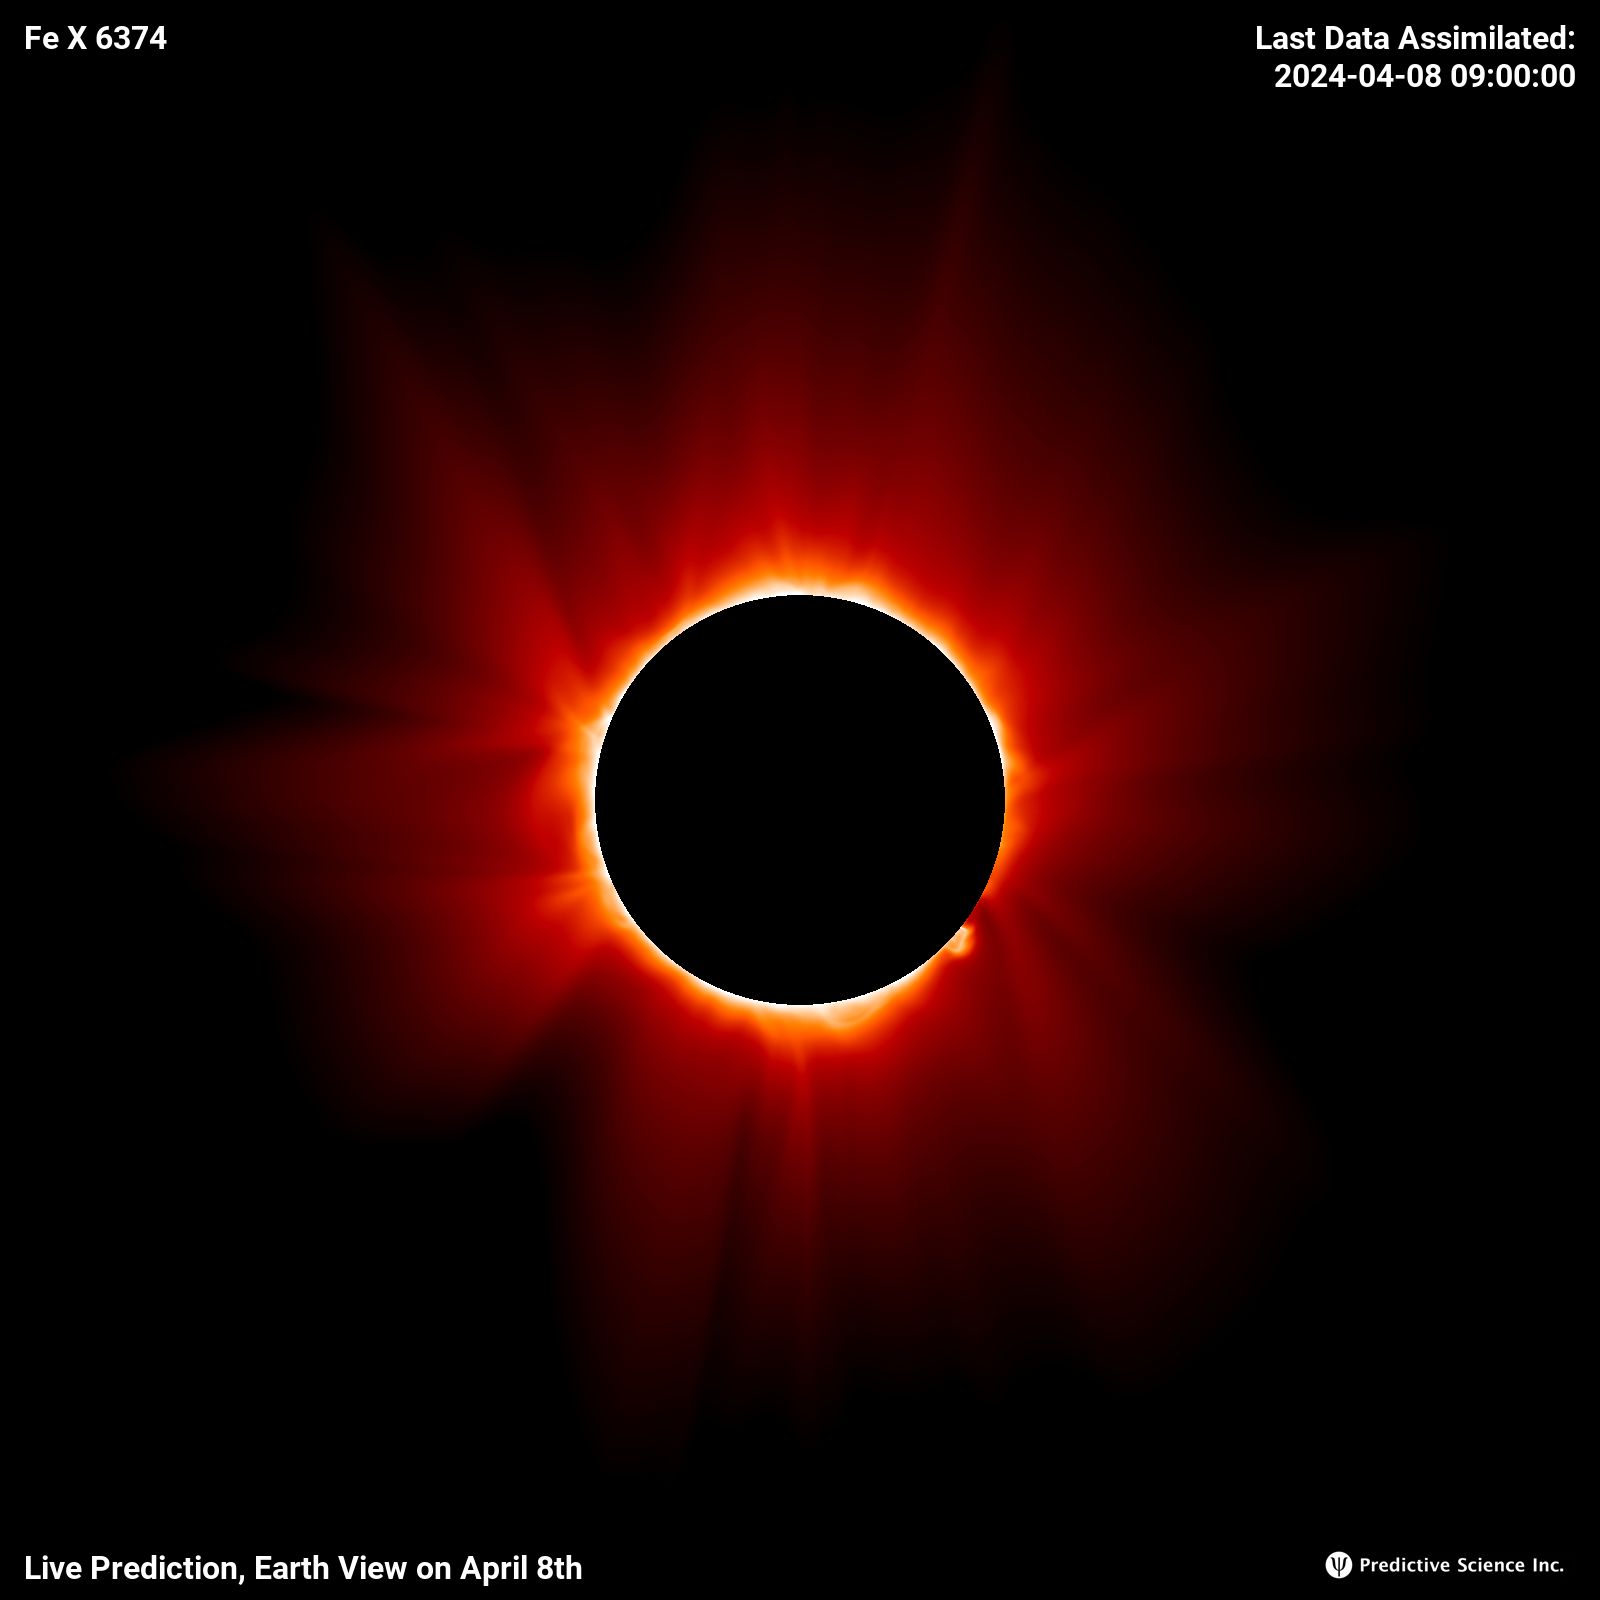
Fe X 6374 Å
(Radiance, Log Scaled)
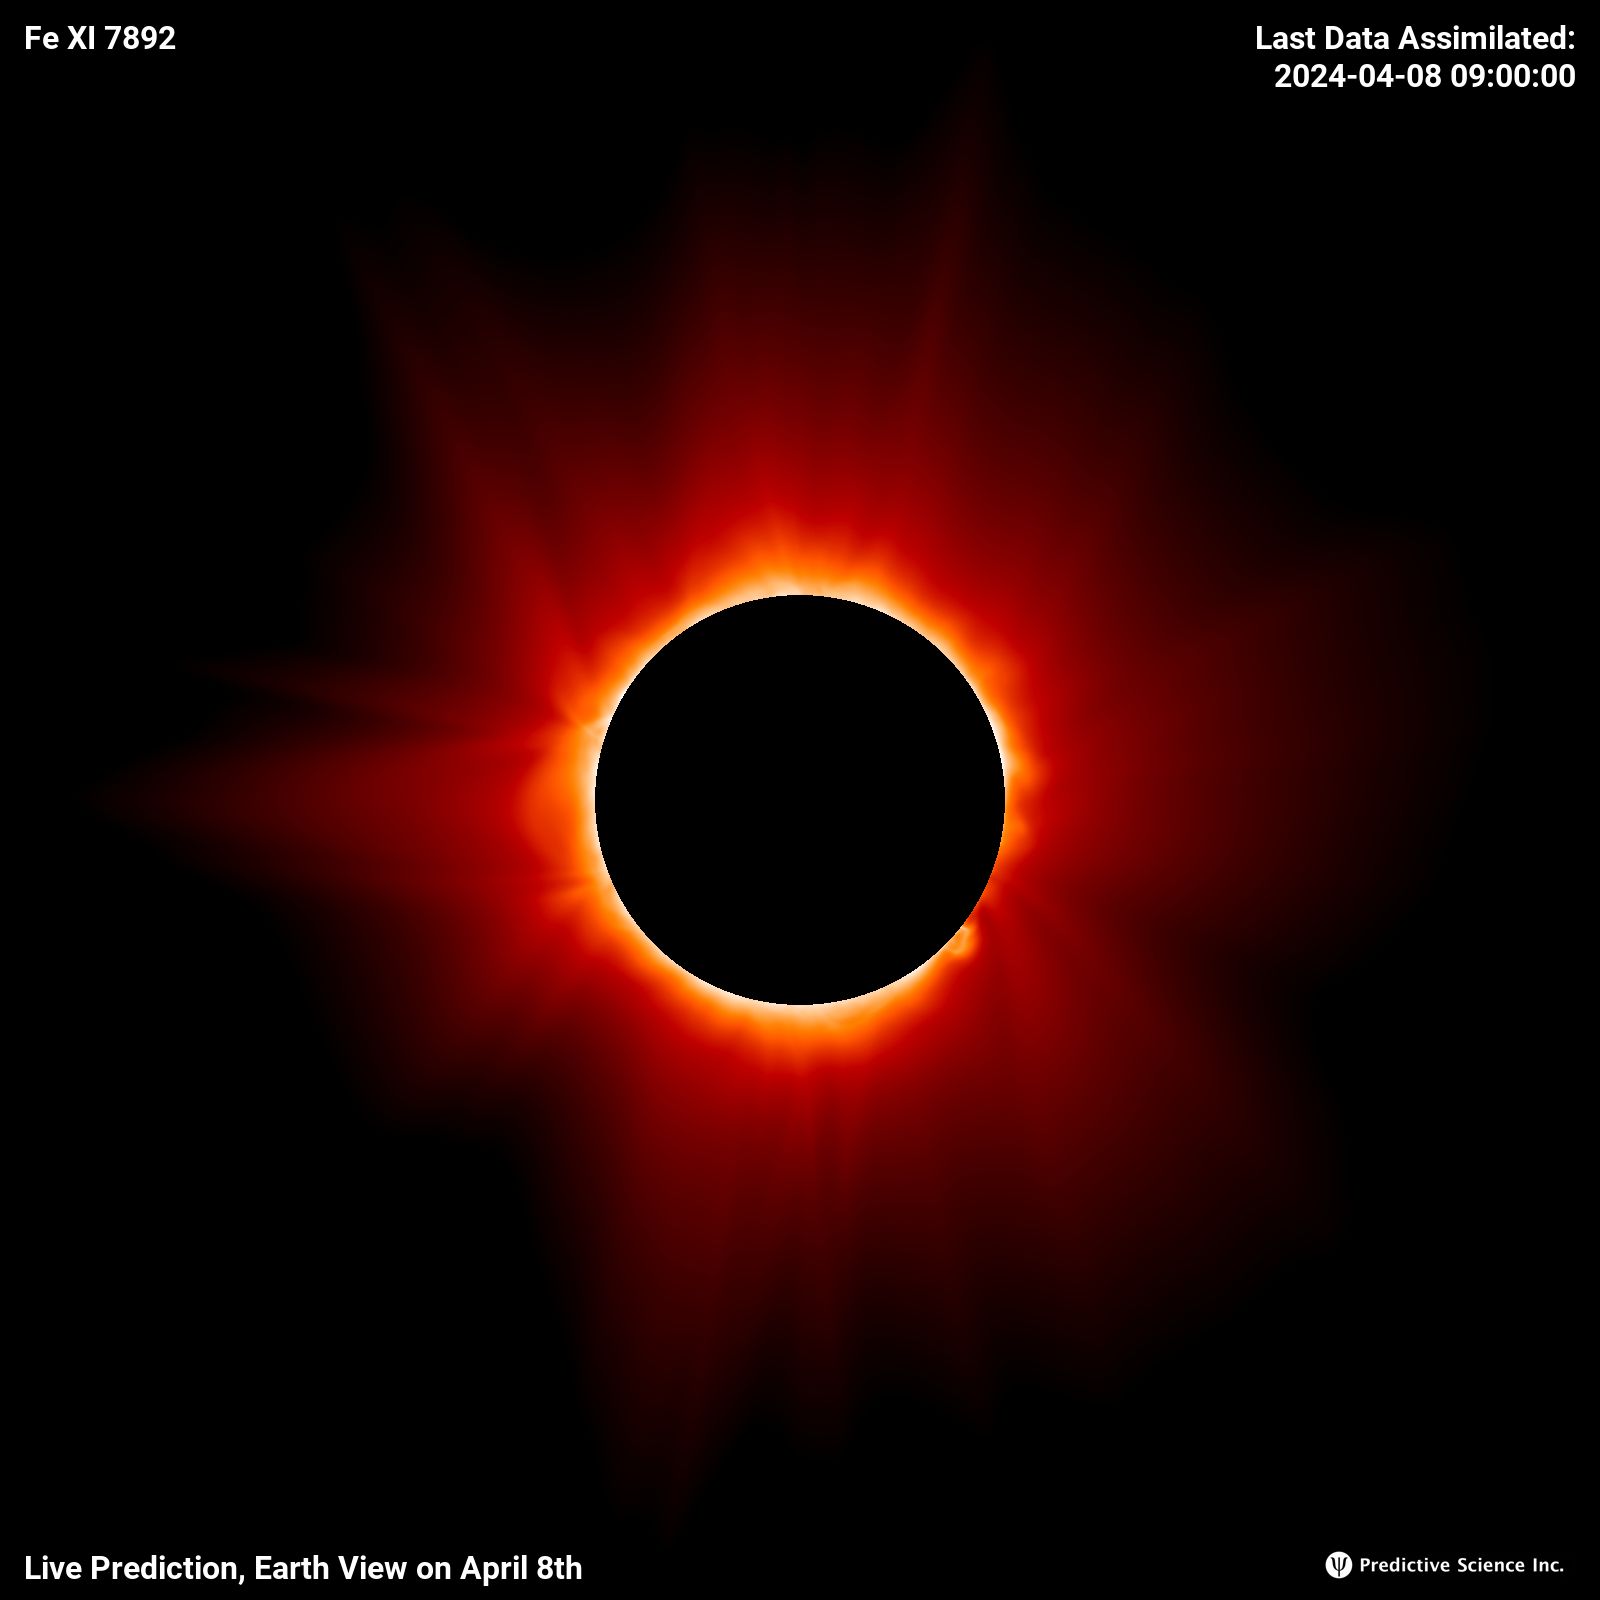
Fe XI 7892 Å
(Radiance, Log Scaled)
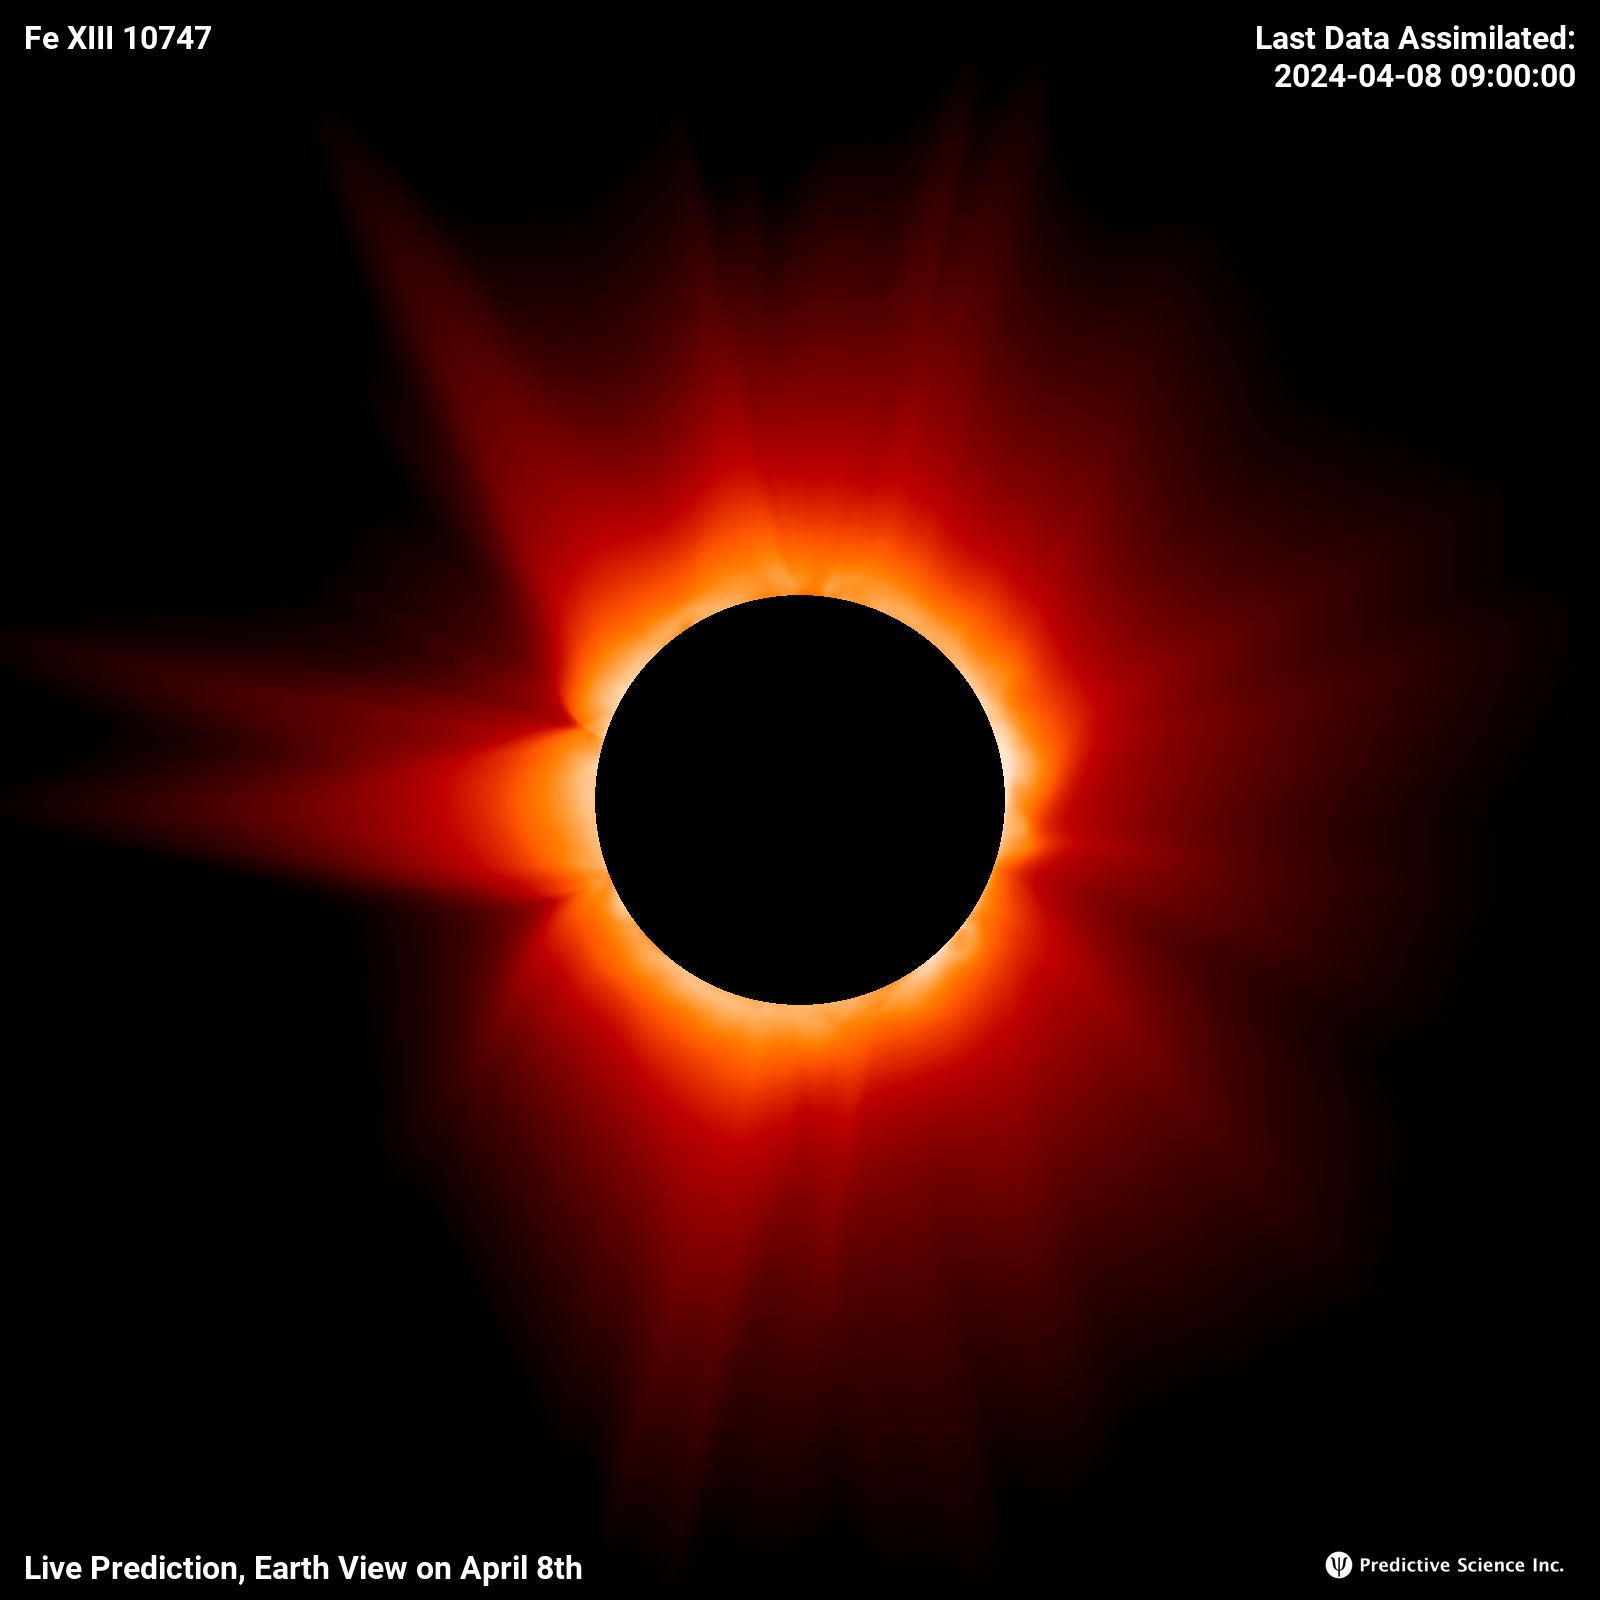
Fe XIII 10747 Å
(Radiance, Log Scaled)
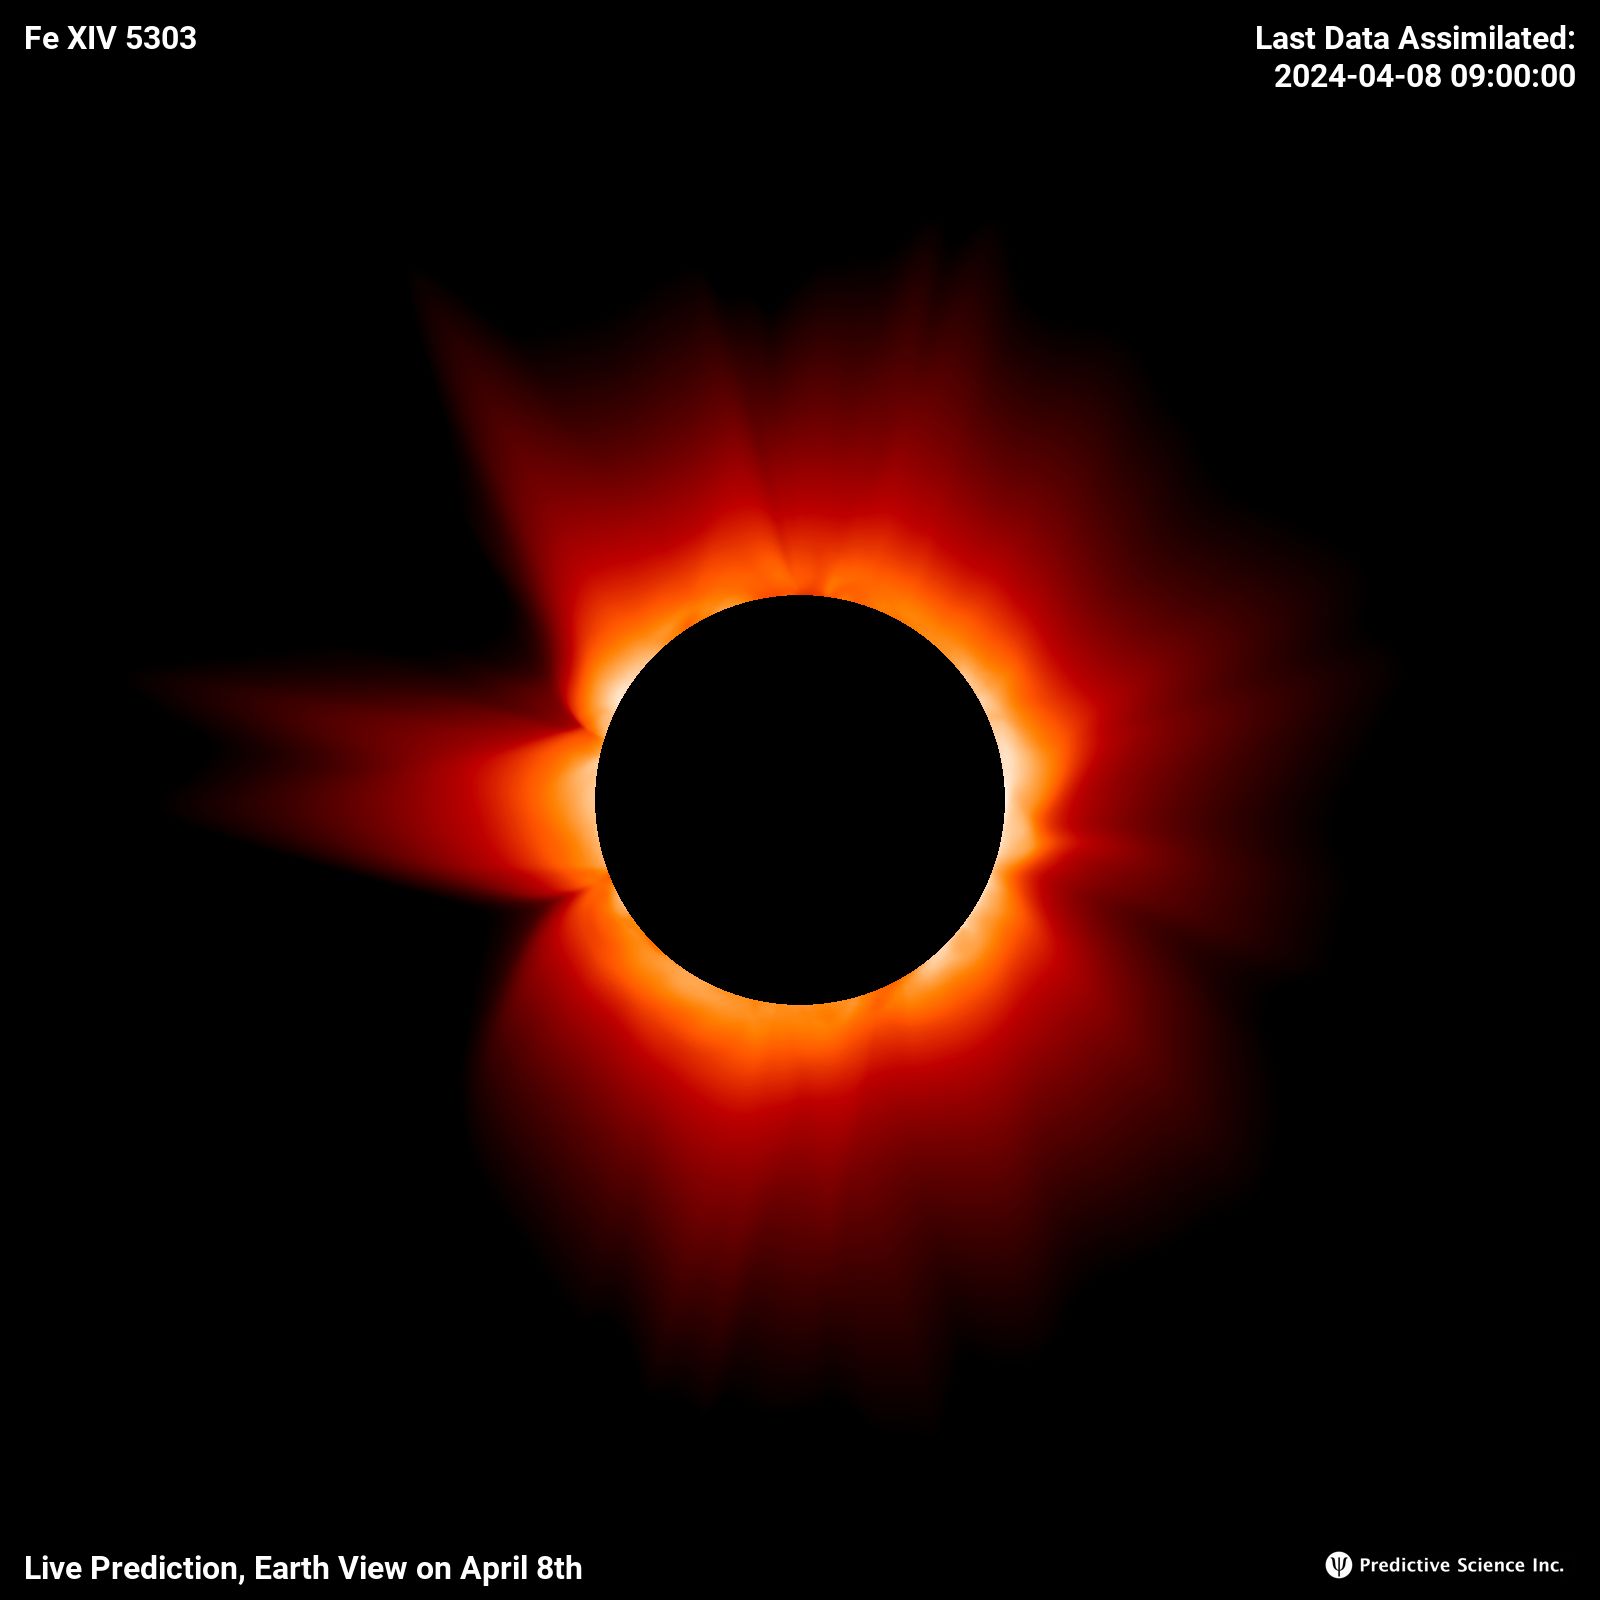
Fe XIV 5303 Å
(Radiance, Log Scaled)
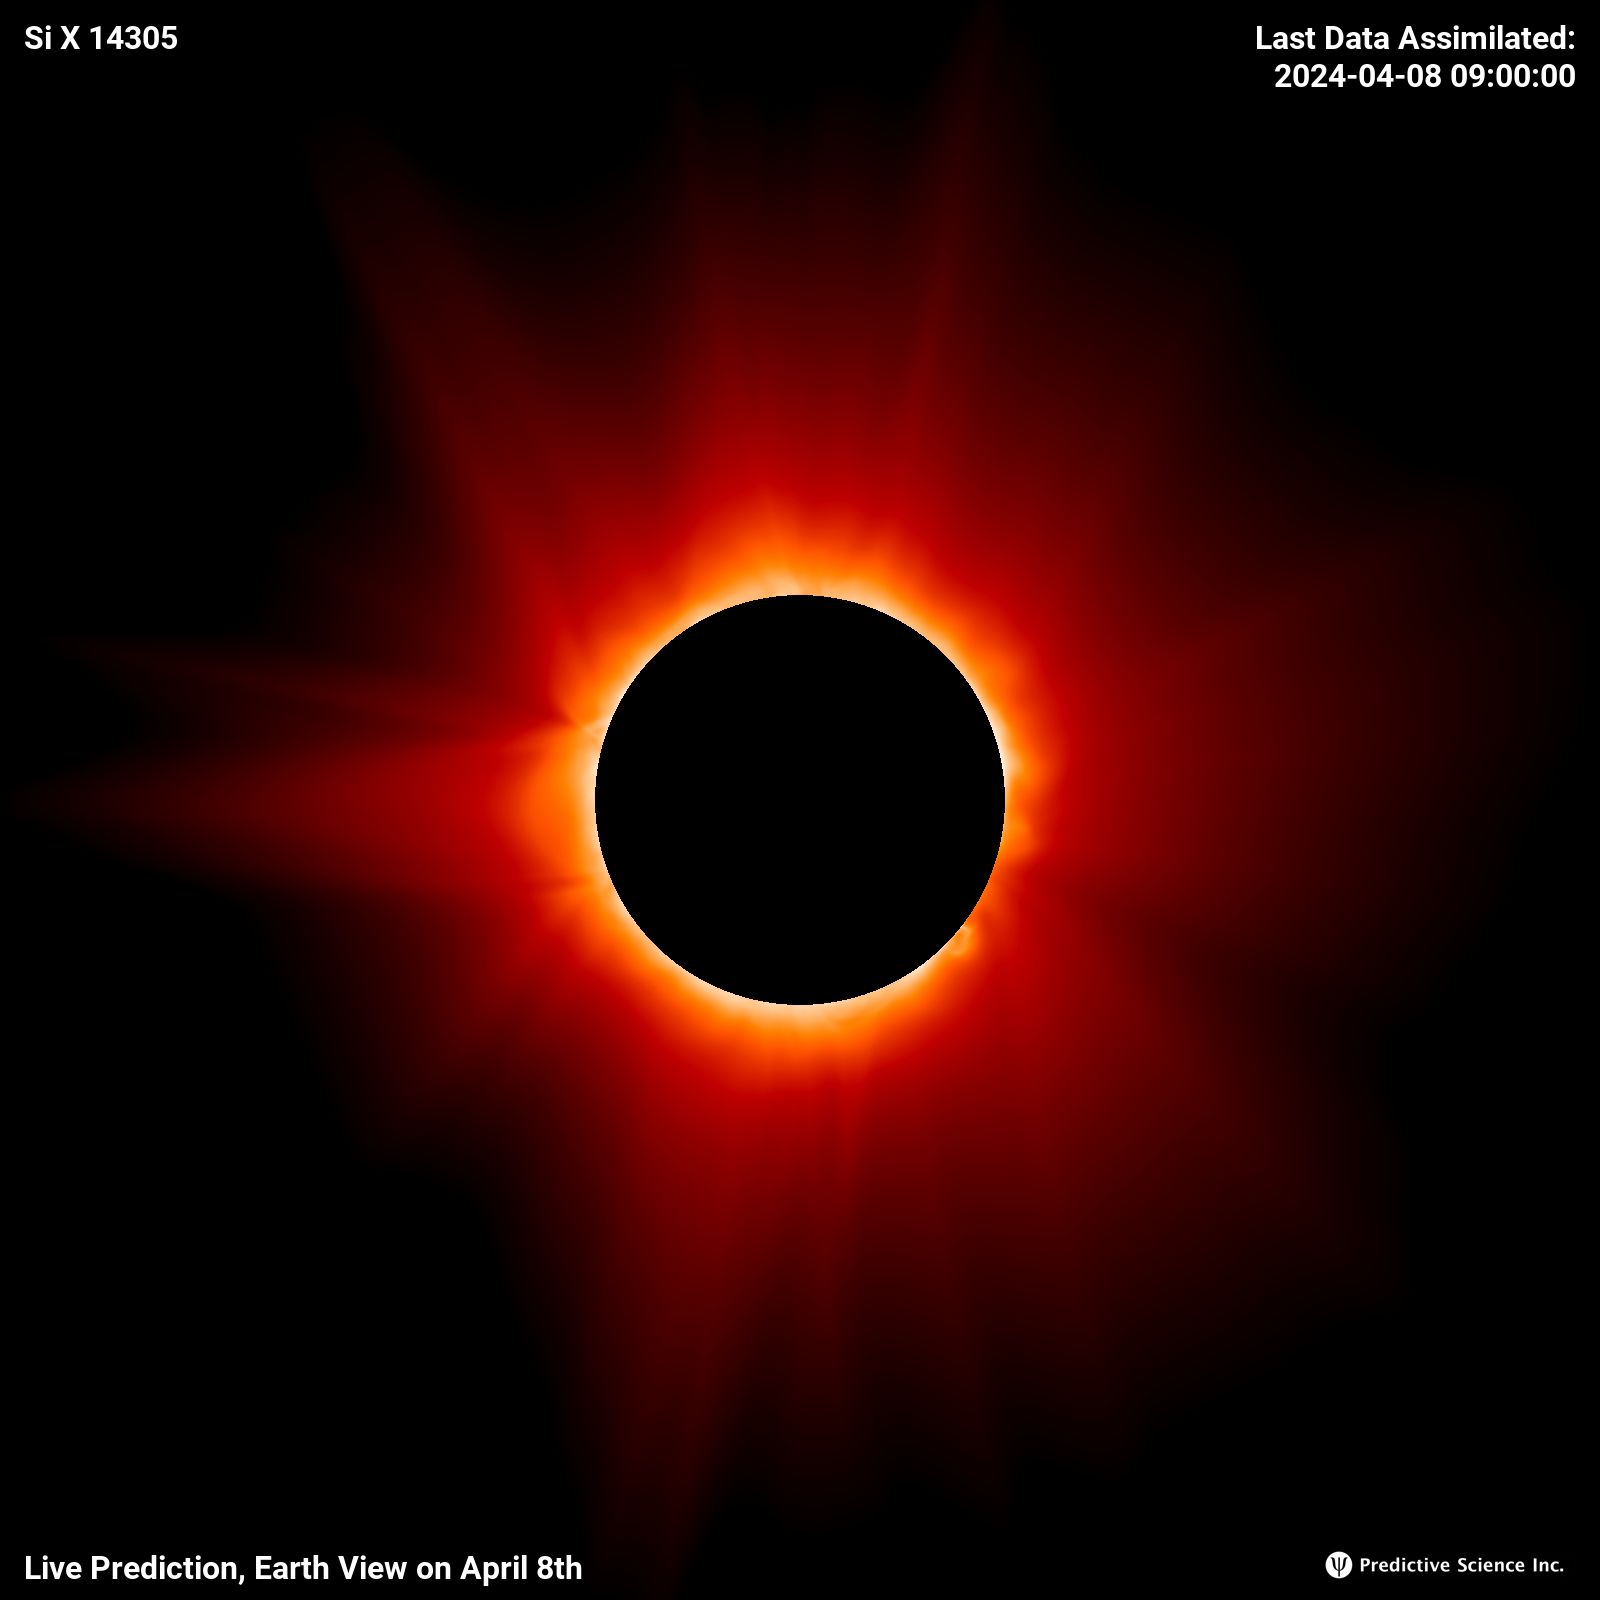
Si X 14305 Å
(Radiance, Log Scaled)
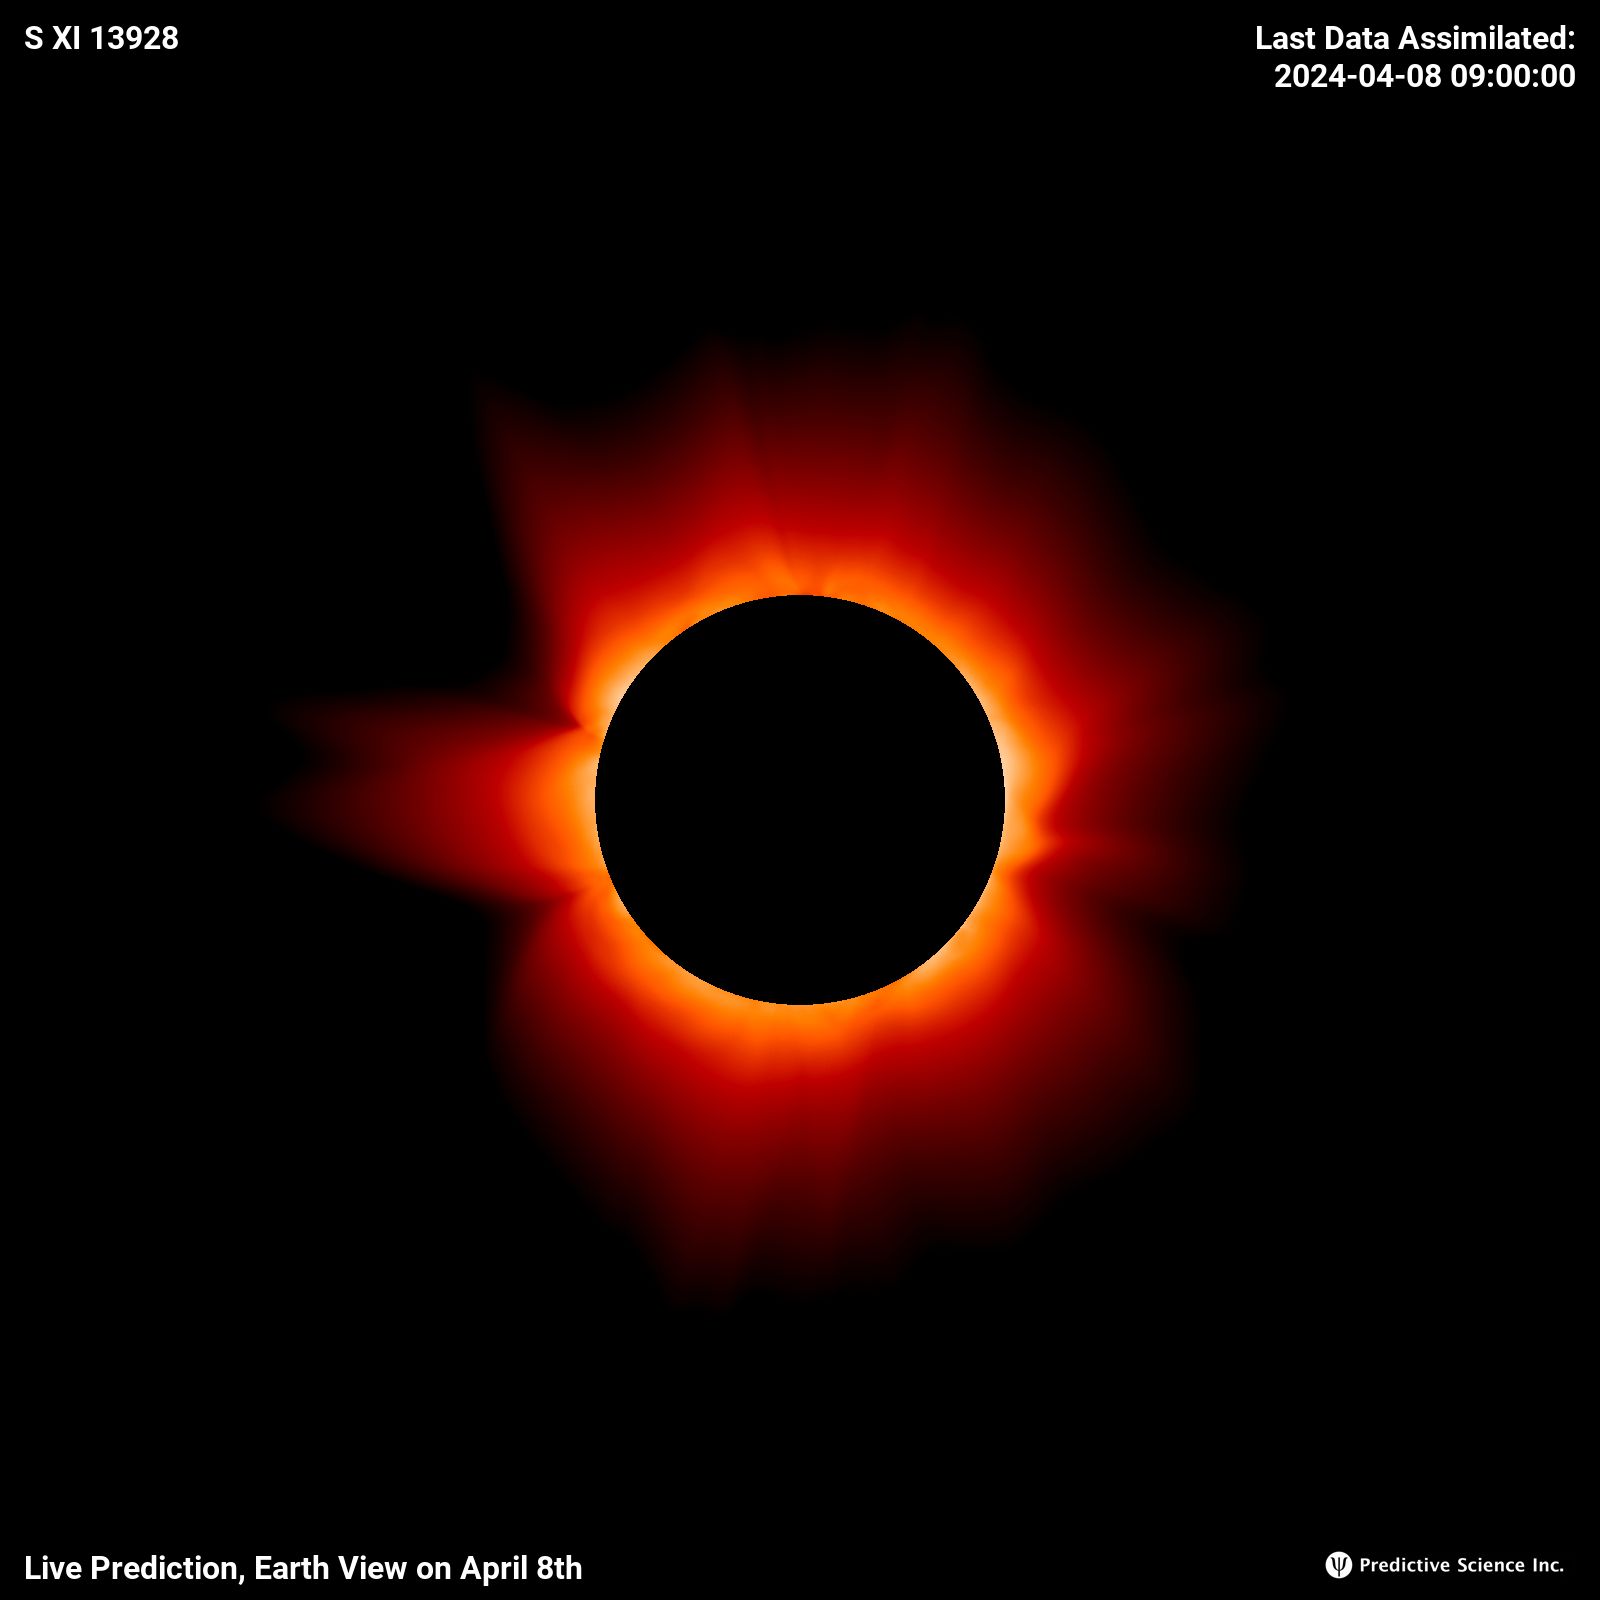
S XI 13928 Å
(Radiance, Log Scaled)
Fe X 6374 Å
(Radiance, Log Scaled)
Fe XI 7892 Å
(Radiance, Log Scaled)
Fe XIII 10747 Å
(Radiance, Log Scaled)
Fe XIV 5303 Å
(Radiance, Log Scaled)
Si X 14305 Å
(Radiance, Log Scaled)
S XI 13928 Å
(Radiance, Log Scaled)
Fe X 6374 Å
(Radiance, Log Scaled)
Fe XI 7892 Å
(Radiance, Log Scaled)
Fe XIII 10747 Å
(Radiance, Log Scaled)
Fe XIV 5303 Å
(Radiance, Log Scaled)
Si X 14305 Å
(Radiance, Log Scaled)
S XI 13928 Å
(Radiance, Log Scaled)
Coronal emission lines in the visible and infrared provide important information about the corona, especially its temperature structure. Unlike emission in extreme ultraviolet (EUV) wavelengths and X-rays, these lines tend to have a strong contribution from photoexcitation, where emission from the solar surface is absorbed and re-radiated by hot coronal ions at specific wavelengths. Total solar eclipses provide a unique opportunity to study these lines from the ground, when the moon occults the much brighter emission from the photosphere. In fact, it was the bright line at 5303 Å, known as the coronal green line, that gave the first hints that million degree plasma must be present somewhere in the solar atmosphere. This is because the line can only be formed by a highly ionized state of iron (Fe 13+, or in astronomical notation: Fe XIV).
Shown here are six of the emission lines in the visible and infrared that are frequently measured during eclipses. The above images show the brightness that would be measured from the ground (radiance) and are just logarithmically scaled.
Shown here are six of the emission lines in the visible and infrared that are frequently measured during eclipses. The above images show the brightness that would be measured from the ground (radiance) and are just logarithmically scaled.