 PVA
Tutorial ▸ Set 1 ▸ 1.1
Example 1.1: Hello World
Build the smallest complete scene (a sphere in a 3-D viewport) and introduce the vocabulary used throughout the tutorial.
Goal
Build the smallest complete scene (a sphere in a 3-D viewport) and introduce the vocabulary used throughout the tutorial.
Keyboard shortcuts are written Ctrl+…; macOS shows the same keys as ⌘.
Terminology
- Node: one box on the canvas that does one job. Its title is editable; its type is fixed.
- Port: a connection point on a node. Inputs are dots; the output is a diamond.
- Edge: a connection from an output diamond to an input dot. Data flows along edges.
- Canvas (graph canvas): the area where nodes live. It pans and zooms freely.
- Viewport: the 3-D view. The main viewport belongs to the XYZ Plotter node; extra Plotters open extra viewports.
- Panes: the five panes, shown by default as tabs in the lower area: Parameters (edits the selected node), Terminal (messages and warnings), Metrics (node count, last pass duration, payload memory, failed and skipped nodes, cache hits, and the components of the selected node’s payload), Canvas (Run, Auto execution, canvas view and the Actions dropdown) and Camera (position and view of the selected viewport).
- Quick Add: the palette of node types and group templates, opened with Ctrl+K. Typing part of a name filters the list; Enter adds the highlighted entry.
- Run, Evaluate, Auto: Run (Ctrl+Shift+Return) evaluates every out-of-date node; Evaluate (Ctrl+Return, also in the Actions dropdown) evaluates the selection; Auto execution (Ctrl+E, the Auto switch in the Canvas pane) re-runs automatically after every edit and is on at launch.
Walkthrough
- Open
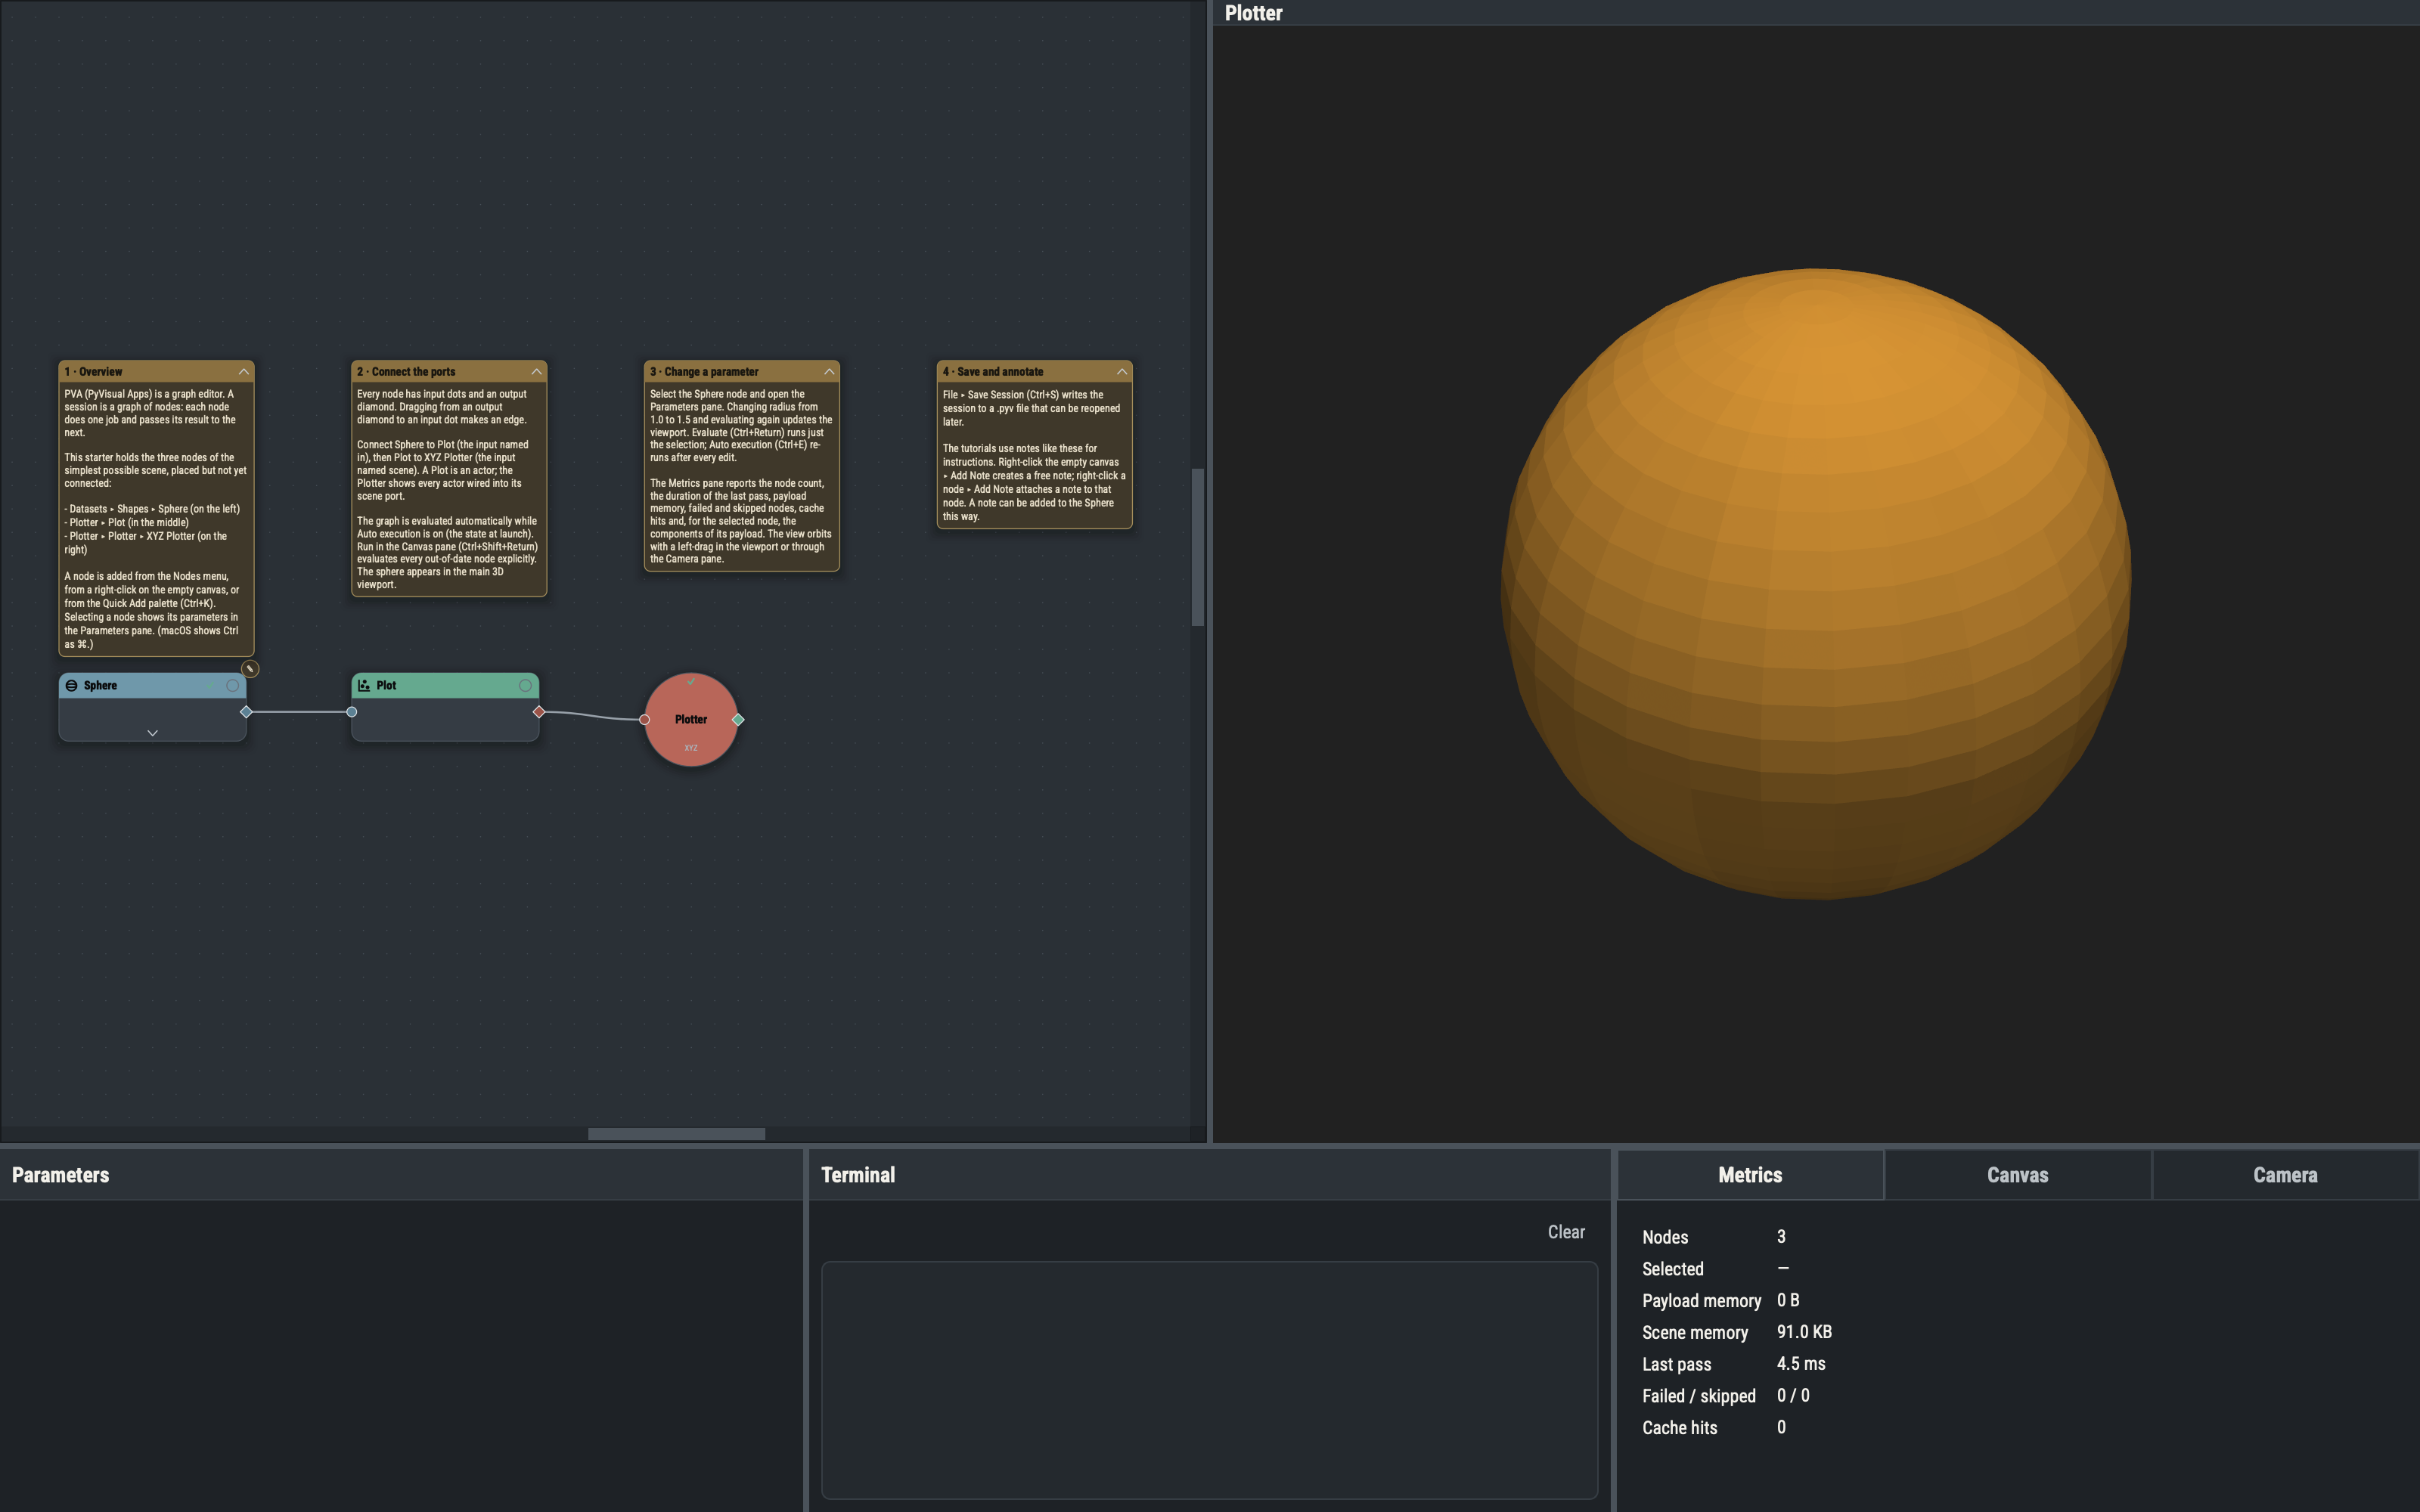
hello-world.pyv. Three nodes are already placed: Sphere, Plot and XYZ Plotter. Nodes are added from the Nodes menu, from a right-click on the empty canvas, or from Quick Add. - Drag from the Sphere’s output diamond to the Plot’s input, then from the Plot to the Plotter’s
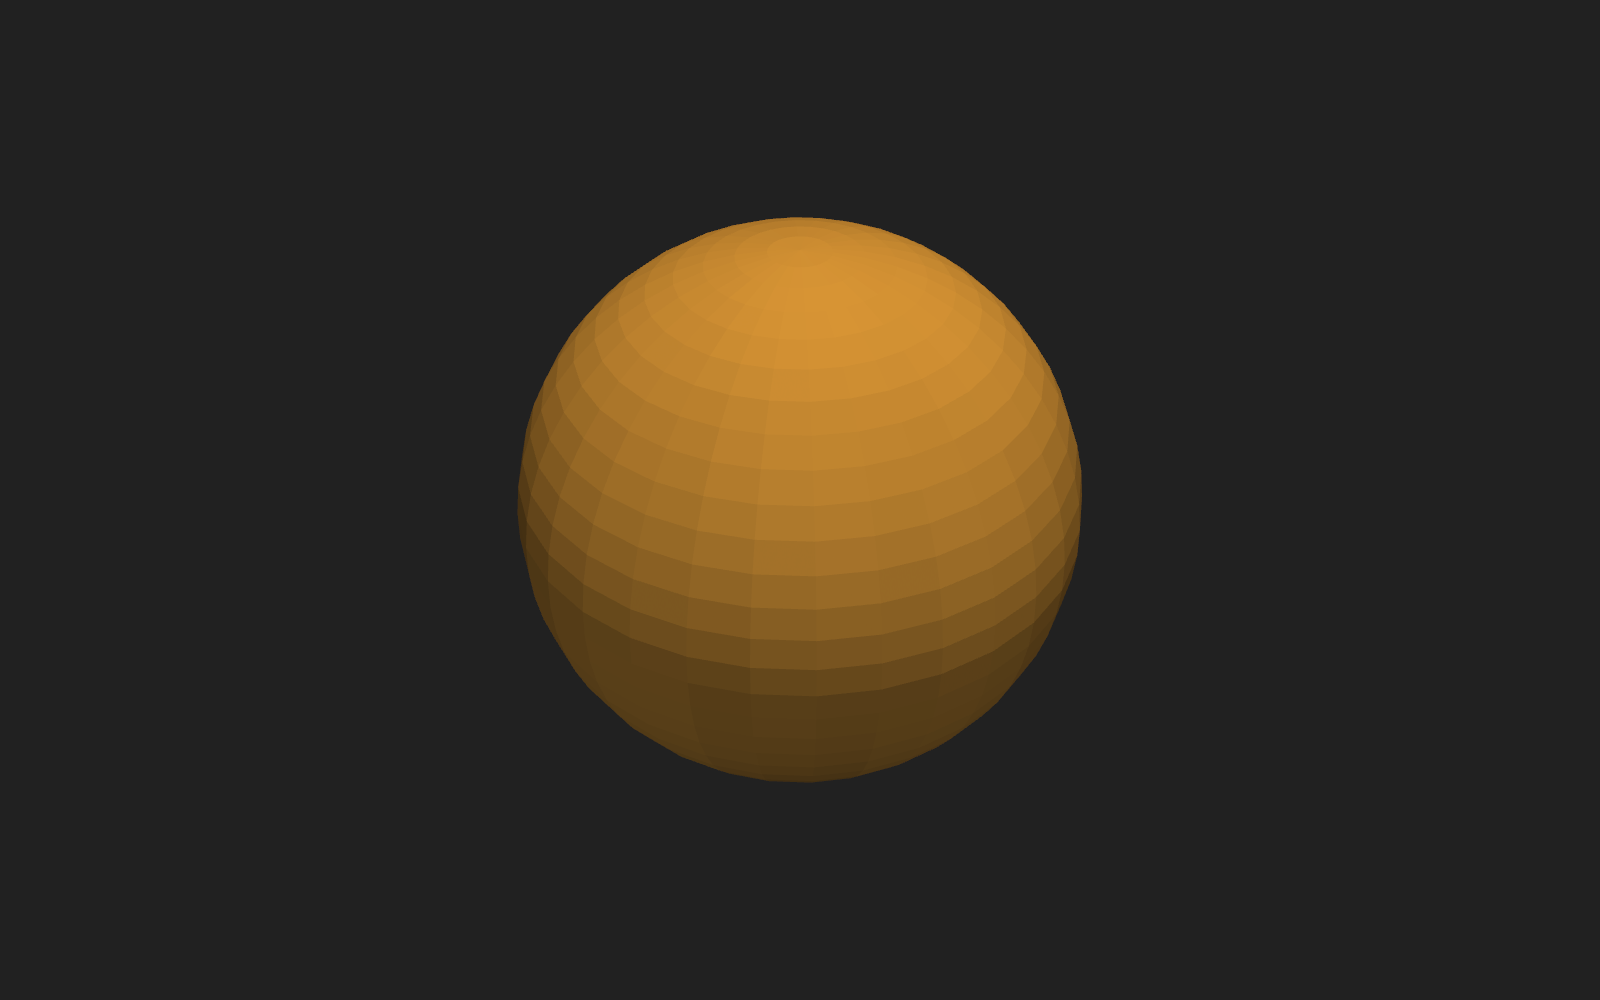
sceneinput. - Run if Auto execution is off. The sphere appears.
- Select the Sphere and change
radiusin the Parameters pane to 1.5. Radius is in R_sun (solar radii), the unit used for distance throughout the app. Run again and read the Metrics pane. - The Camera pane, or a left-drag in the viewport, orbits the view.
Saving
File ▸ Save Session (Ctrl+S) writes a .pyv file holding the graph, the notes and the view. The file can be reopened at any time.
Notes
A free note floats on the canvas, like the numbered ones above the nodes. A hosted note attaches to a node or group and collapses to a small corner icon. Right-click the canvas or a node ▸ Add Note creates one.
Variations
- Changing the Plot’s
colorrecolors the sphere; enablingshow_edgesdraws the mesh edges. - Lowering the Sphere’s
theta_resolutionandphi_resolutionto 8 makes the facets visible. - A second Sphere with a different
center, wired to the same Plotter, adds a second object to the scene.
Example 1.2 reads real solar data.