add_contour#
- GridMeshMixin.add_contour(
- r,
- t,
- p,
- data,
- /,
- dataid='Data',
- isovalue=None,
- **kwargs,
Add an isosurface contour from a 3-D spherical scalar field.
Builds a
SphericalMesh, extracts the isosurface atisovalueviapyvista.DataSet.contour(), and adds the resulting surface mesh to the scene.- Parameters:
- r, t, p
ArrayLike Spherical coordinate arrays. May be 1-D axis vectors or 3-D meshgrids.
- data
ArrayLike Scalar field from which the isosurface is extracted.
- dataid
str, optional Name for the scalar array. Default is
'Data'.- isovalue
ArrayLike|None, optional Contour value(s) at which to extract the isosurface. Defaults to
0whenNone.- **kwargs
Additional keyword arguments forwarded to
add_mesh().
- r, t, p
- Returns:
- out
pyvista.Actor The rendered isosurface actor.
- out
Examples
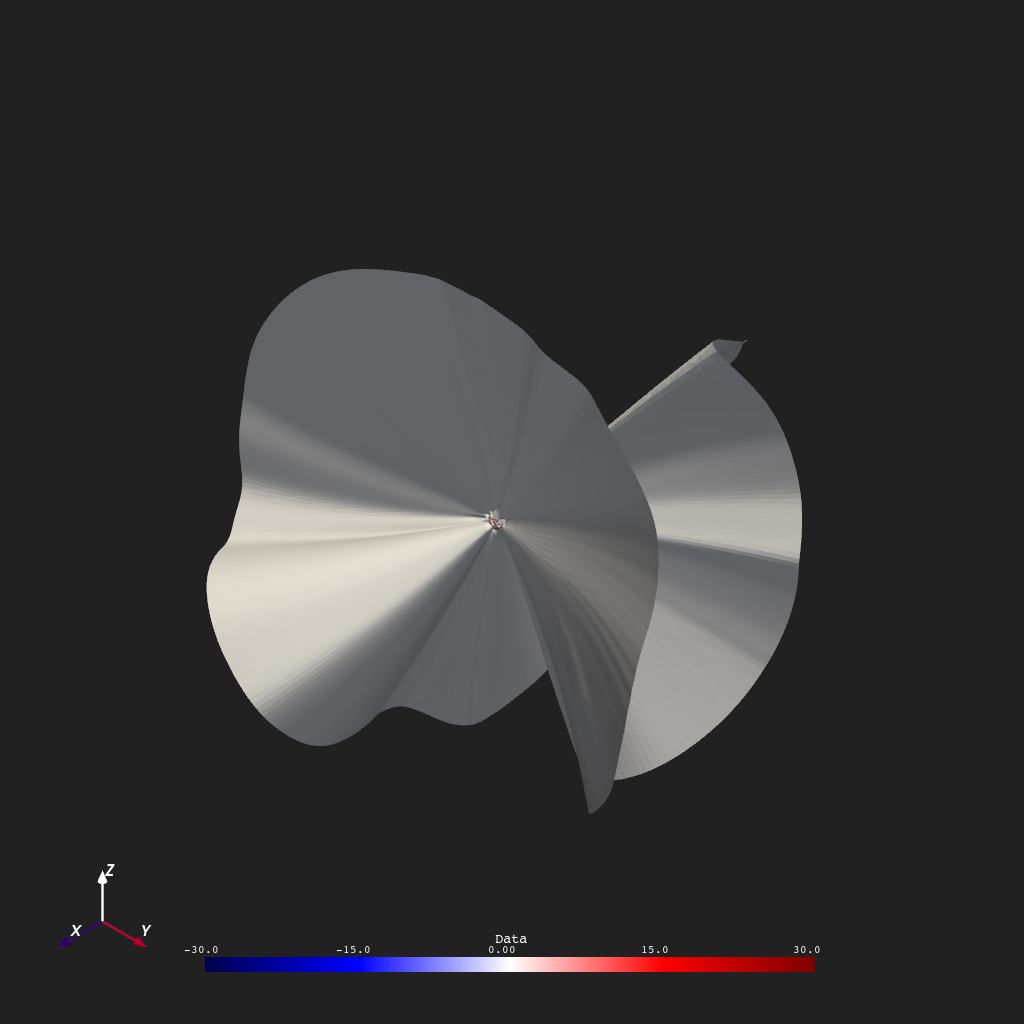
Extract the \(B_r = 0\) isosurface from the full 3-D coronal field. This surface is the polarity inversion boundary shown against a constant-\(r\) background slice of \(B_r\) for context.
>>> from pyvisual import Plot3d
>>> from pyvisual.utils.data import fetch_datasets
>>> from psi_io import read_hdf_data
>>>
>>> datafile = fetch_datasets("cor", "br")
>>> data, r, t, p = read_hdf_data(datafile.cor_br)
>>>
>>> plotter = Plot3d()
>>> plotter.show_axes()
>>> plotter.add_contour(r, t, p, data, color='white')
>>> plotter.add_2d_slice(r[1], t, p, data[...,1], cmap="seismic", clim=(-30, 30))
>>> plotter.show()