Note
Go to the end to download the full example code.
Structured Spline Grids#
This example demonstrates add_grid()
— the general method for adding structured spline grids to the scene. Each
axis is specified as a 4-tuple (min, max, num_splines, resolution), and
the method draws three sets of splines (one per axis) as a
pyvista.MultiBlock.
The higher-level convenience methods
add_longitudinal_lines(),
add_latitudinal_lines(), and
add_longlat_lines() are built on top
of add_grid().
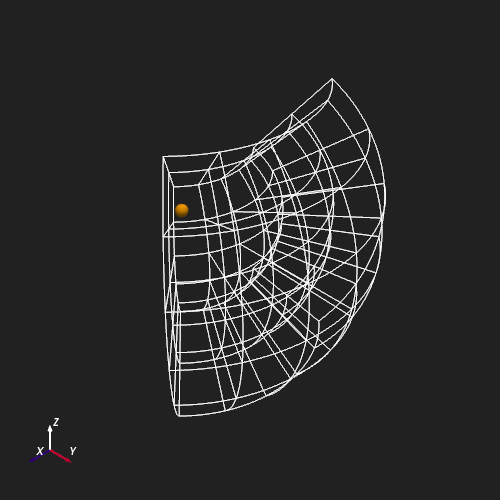
3-D Structured Grid Volume#
The grid below spans a coronal volume between
\(r \in [15,\,30]\,R_\odot\), \(\theta \in [\pi/4,\,3\pi/4]\), and
\(\phi \in [\pi/4,\,3\pi/4]\). The 4-tuple arguments control how many
splines run perpendicular to each axis (num_splines) and how many
sample points trace each individual spline (resolution).
radial_args = 15, 30, 3, 2
theta_args = pi / 4, 3 * pi / 4, 6, 60
phi_args = pi / 4, 3 * pi / 4, 6, 60

plotter = Plot3d()
plotter.show_axes()
plotter.add_sun()
plotter.add_grid(radial_args, theta_args, phi_args)
plotter.show()
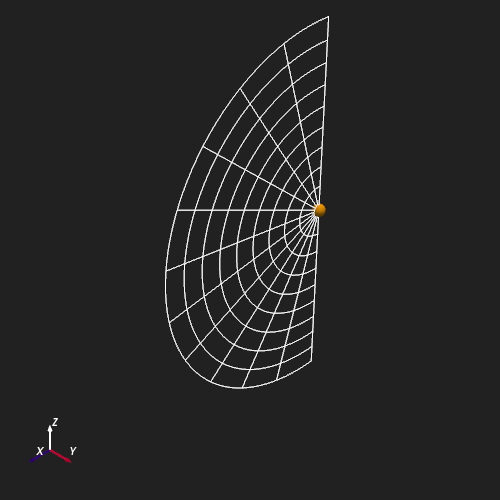
Meridional Cross-Section#
Setting num_splines=1 and resolution=1 on the \(\phi\) axis
collapses the grid to a single meridional plane at \(\phi = 0\).
The result shows 10 radial spokes spanning
\(r \in [1,\,30]\,R_\odot\) and 12 colatitudinal arcs from
pole to pole.
radial_args = 1, 30, 10, 2
theta_args = 0, pi, 12, 60
phi_args = 0, 0, 1, 1

plotter = Plot3d()
plotter.show_axes()
plotter.add_sun()
plotter.add_grid(radial_args, theta_args, phi_args)
plotter.show()
Total running time of the script: (0 minutes 0.950 seconds)