Note
Go to the end to download the full example code.
Longitudinal and Latitudinal Lines#
This example demonstrates how to add longitudinal and latitudinal lines to a Plot3d instance.
These PolyData objects can be used as reference lines for the grid, or as
a visual aid to indicate the orientation of the scene.
from pyvisual import Plot3d
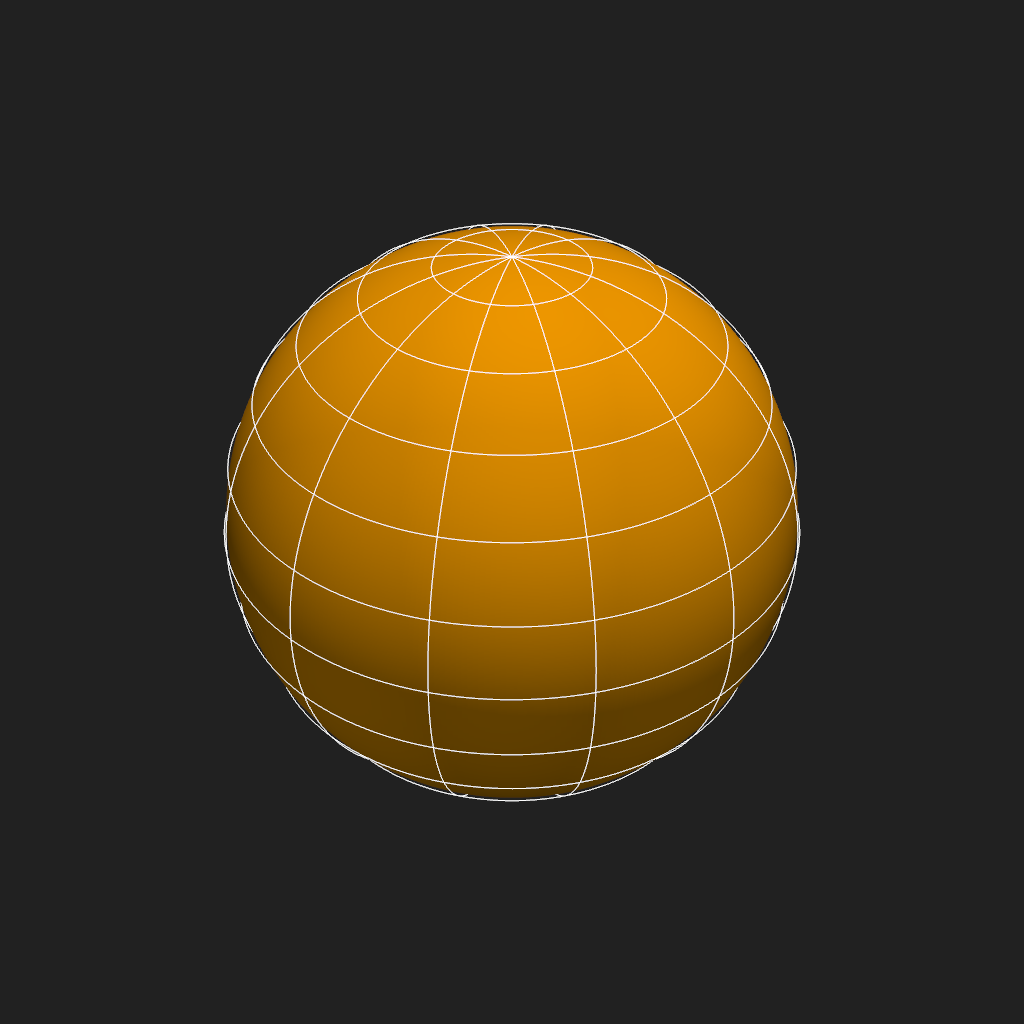
Create a Plot3d instance and add the sun (a “reference” sphere, centered at the origin, with
radius 1 \(R_\odot\)) to the scene. Using the default arguments for the
add_latitudinal_lines() and
add_longitudinal_lines() methods creates lines every
15° and 30° (respectively), at 1.01 \(R_\odot\).
plotter = Plot3d()
plotter.add_sun()
plotter.add_latitudinal_lines()
plotter.add_longitudinal_lines()
plotter.show()
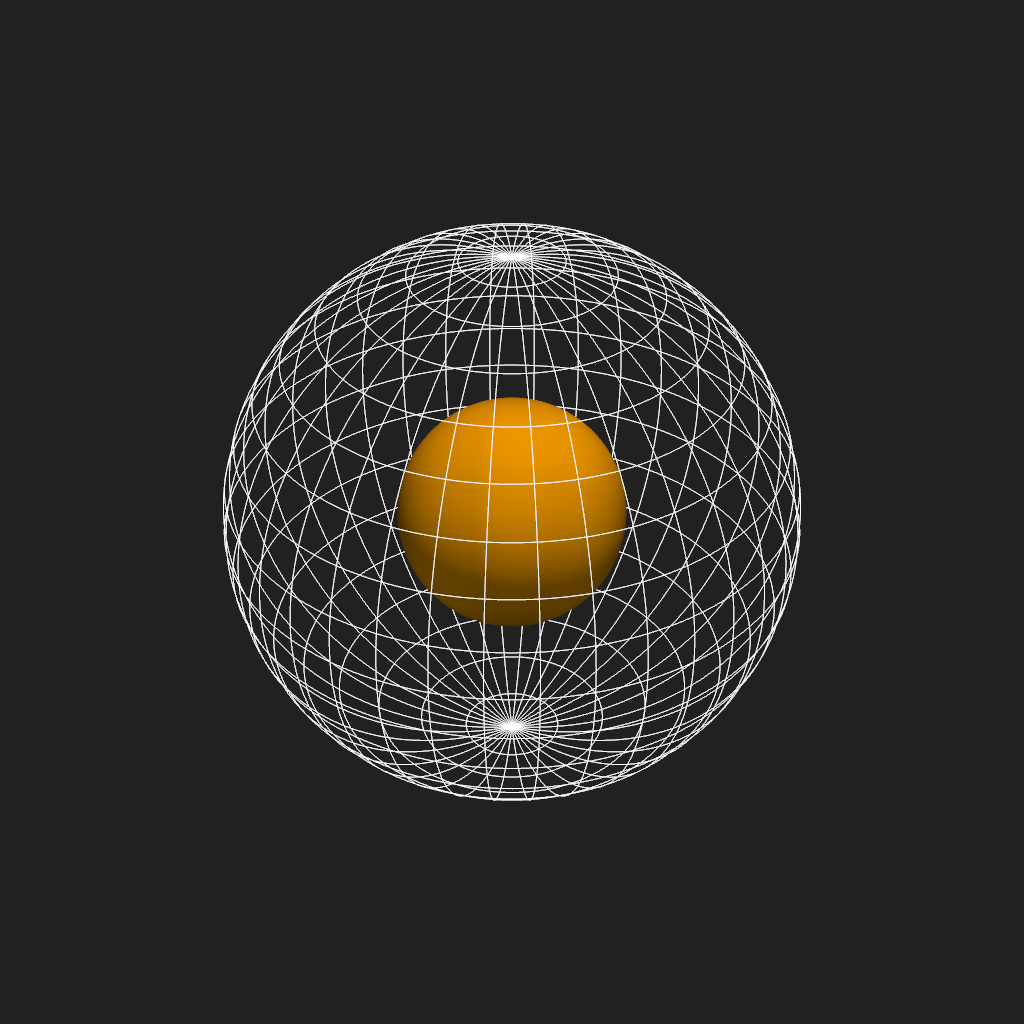
Alternatively, you can create denser or sparser lines by changing the lat_deg and lon_deg
arguments, or add lines at a different radius by changing the radius argument.
plotter = Plot3d()
plotter.add_sun()
plotter.add_latitudinal_lines(lat_deg=10, radius=2.5)
plotter.add_longitudinal_lines(lon_deg=10, radius=2.5)
plotter.show()
Total running time of the script: (0 minutes 0.964 seconds)