add_splines#
- Plot3d.add_splines(r, t, p, data=None, /, axis=0, dataid='Data', **kwargs)#
Add a bundle of splines through spherical coordinate arrays.
- Parameters:
- r, t, p
ArrayLike N-D coordinate arrays of identical shape. The
axisdimension enumerates individual spline paths.- data
ArrayLike|None, optional Scalar values. Default is
None(solid color).- axis
int, optional The axis that enumerates distinct splines. Default is
0.- dataid
str, optional Name for the scalar array. Default is
'Data'.- **kwargs
Additional keyword arguments forwarded to
add_mesh().
- r, t, p
- Returns:
- out
pyvista.Actor The rendered spline-bundle actor.
- out
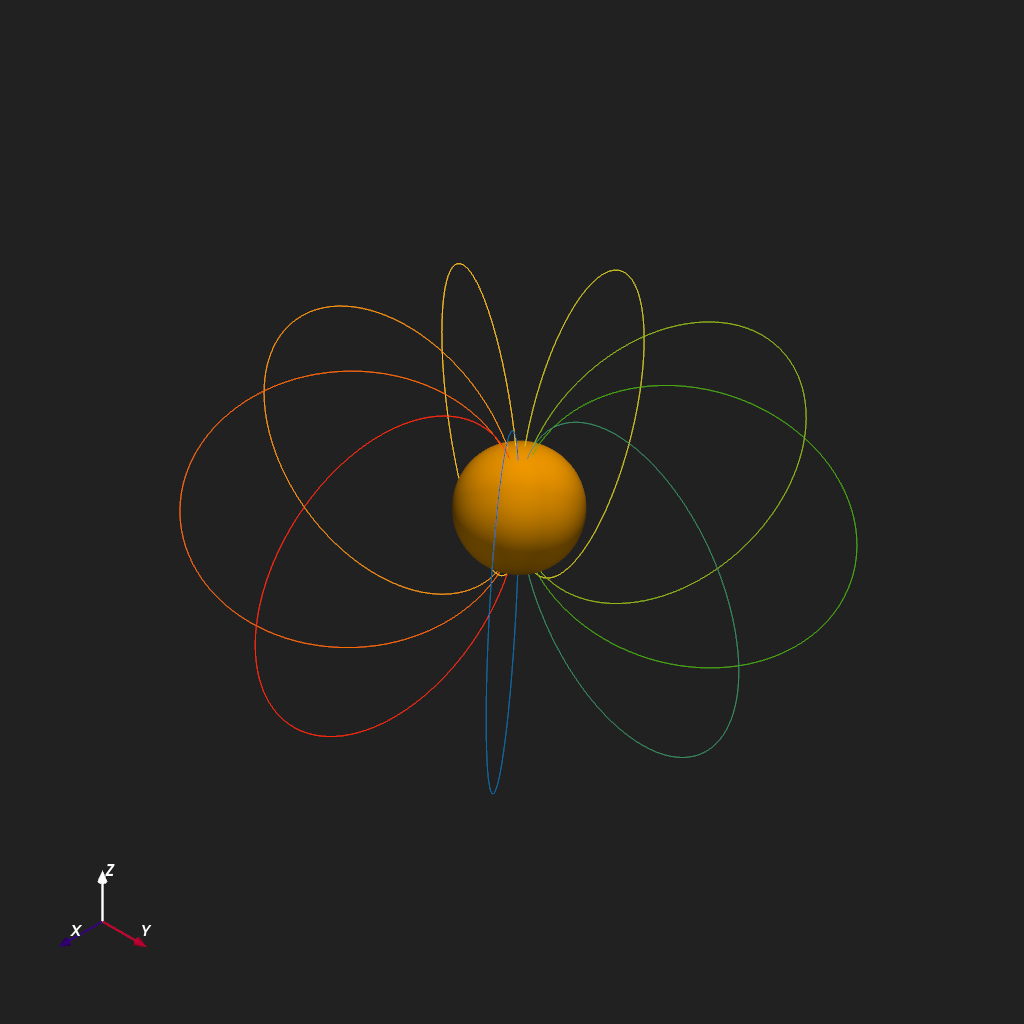
Examples
Ten meridional splines connecting the north and south poles, colored by spline index. Each coordinate array has shape
(10, 100). Passingaxis=1declares that axis 1 (length 100) is the fastest-varying dimension — the 100 points that trace each individual path. The remaining axis (or axes in higher-dimensional cases) enumerate distinct splines.>>> import numpy as np >>> from pyvisual import Plot3d >>> >>> n_lines, n_pts = 10, 100 >>> r = np.tile(5 * np.sin(np.linspace(0, np.pi, n_pts)), (n_lines, 1)) >>> t = np.tile(np.linspace(0, np.pi, n_pts), (n_lines, 1)) >>> p = np.tile(np.linspace(0, 2 * np.pi, n_lines)[:, None], (1, n_pts)) >>> data = np.arange(n_lines) >>> >>> plotter = Plot3d() >>> plotter.show_axes() >>> plotter.add_sun() >>> plotter.add_splines(r, t, p, data, axis=1, show_scalar_bar=False) >>> plotter.show()