Note
Go to the end to download the full example code.
The Thomson Sphere#
This example demonstrates add_thompson_sphere()
— a convenience method that adds the Thomson sphere for a given observer
position.
The Thomson sphere is the sphere centered halfway between the Sun and the observer, with radius \(\|\mathbf{p}_\text{obs}\|/2\). It represents the locus of points of maximum Thomson scattering efficiency along any line of sight through the corona: a photon emitted from a coronal electron contributes most strongly to an observer’s signal when that electron lies on or near this sphere.
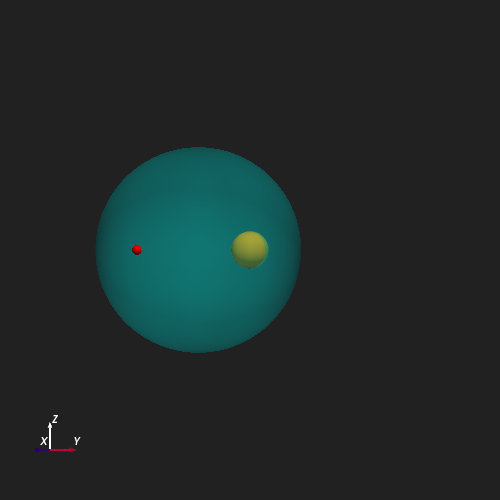
Thomson Sphere for an Equatorial Observer#
Place an observer at \(r = 10\,R_\odot\) on the equatorial plane (\(\theta = \pi/2,\,\phi = 0\)). The Thomson sphere is centered at \((5\,R_\odot, 0, 0)\) with radius \(5\,R_\odot\). The observer’s position is marked with a red point for reference, and the camera is moved to a wider vantage point to show the full geometry.
observer_position = 10, pi / 2, 0

plotter = Plot3d()
plotter.show_axes()
plotter.add_sun()
plotter.observer_position = observer_position
plotter.add_thompson_sphere(opacity=0.3, color='cyan')
plotter.add_point(*observer_position, color='red', point_size=10)
plotter.observer_position = 50, pi / 2, pi / 6
plotter.show()
Total running time of the script: (0 minutes 0.689 seconds)