 PVA
Guide / Chapter 11
Metrics Pane
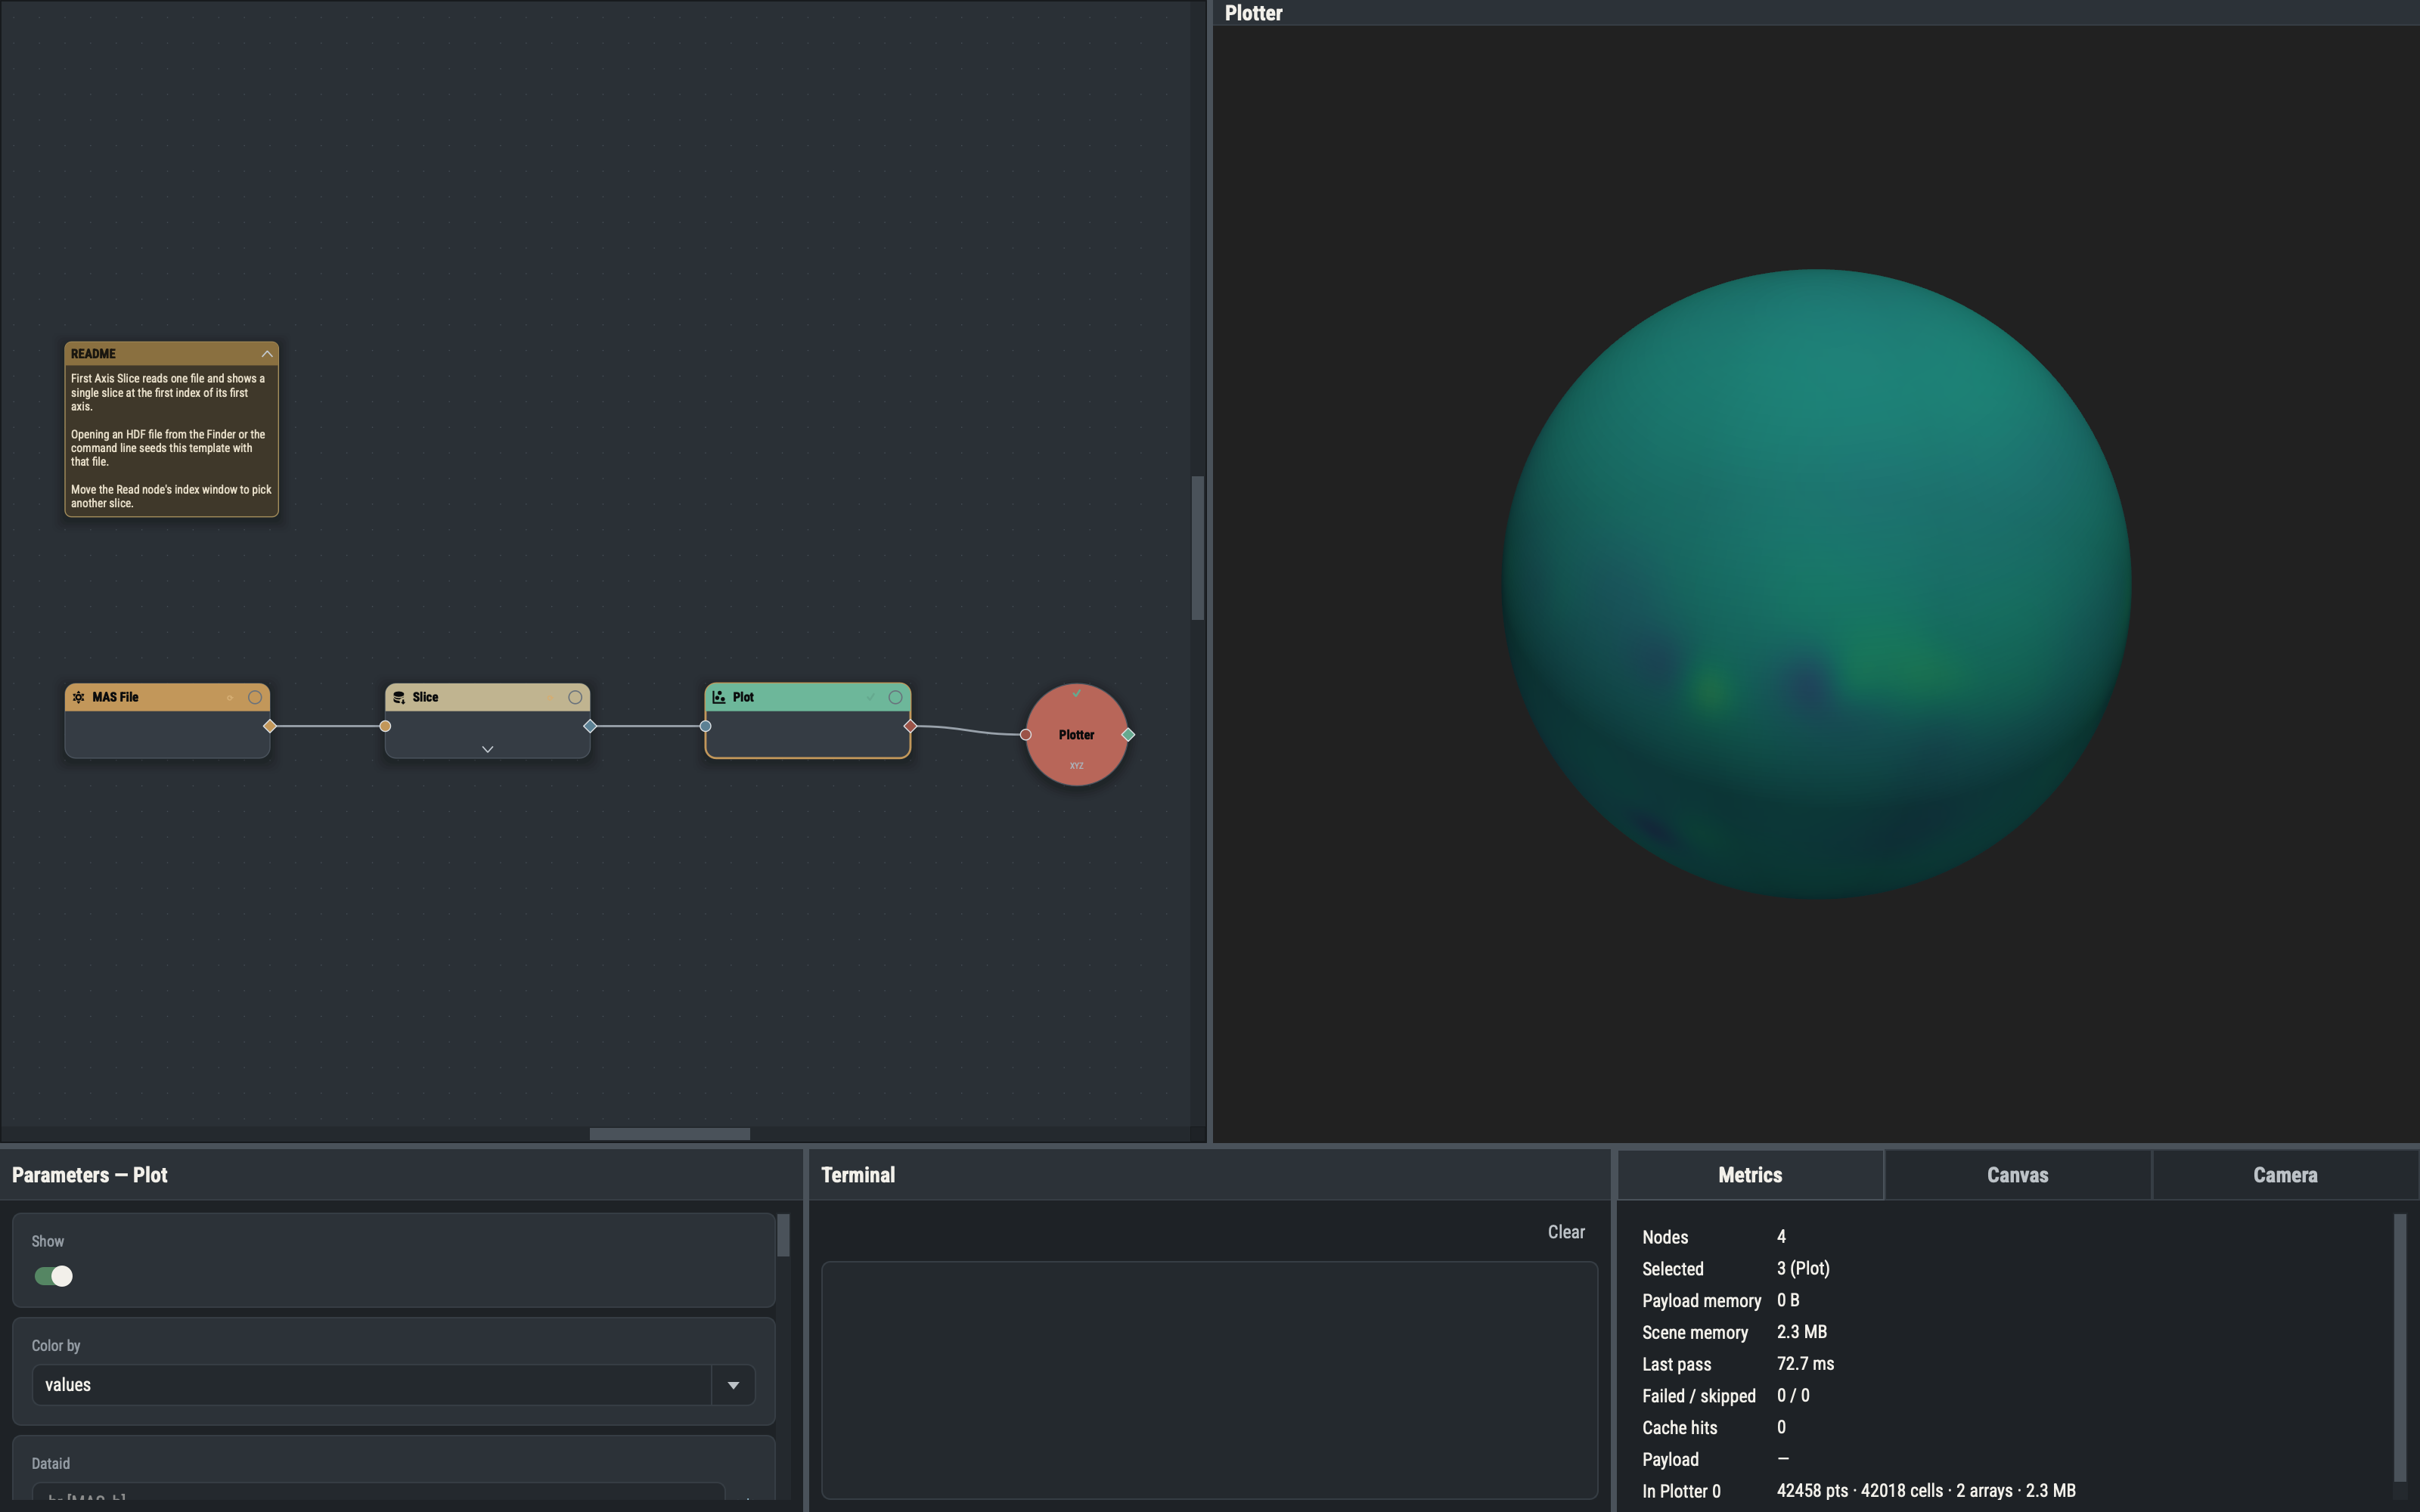
The Metrics pane reports memory and evaluation figures for the session, and describes the selected node’s payload.
Session rows
These seven rows are always shown.
| Row | Meaning |
|---|---|
| Nodes | The number of nodes in the graph. |
| Selected | The id and type of the selected node, such as 7 (Slice); — unless exactly one node is selected. |
| Payload memory | The total size of data held in node caches. It counts only cached arrays and datasets; Plot render descriptions, other non-array results and unevaluated nodes add nothing. Sizes read in B, KB, MB or GB. |
| Scene memory | The memory held by data drawn in every live 3-D viewport, across all Plotters. Data shared by several drawn objects is counted once. |
| Last pass | The summed per-node compute time of the most recent pass, in milliseconds; — before any pass. |
| Failed / skipped | Two counts: nodes that failed, and nodes that the pass did not run to completion. |
| Cache hits | How often in the session a requested node was served from a clean cache instead of being recomputed, so it shows whether the auto-cache rule is paying off (Caching). |
Per-node timings and per-node memory are tracked, but the pane shows only the totals above.
The selected node
With exactly one node selected, the pane adds rows below the session figures.
- Payload gives the payload description, a dataset’s caption or a primitive’s description. A node that has not been evaluated reads
not evaluated — Evaluate. When the node no longer keeps its result but the latest pass computed it, the row is labeledPayload (last pass, not cached)and shows that pass’s description. - Shape, Dtype and Units describe a single-array payload.
- For a dataset, one indented row per component gives its shape, dtype and unit as
shape · dtype · unit, with—for no unit. - For a Plot, one In Plotter row per Plotter it is drawn in, named by the Plotter’s node id, gives the point, cell and array counts and the size of its data there, for example
12000 pts · 11800 cells · 1 arrays · 468.8 KB.
A node that reads from disk (a reader, Read, a Tracer, Vector Field or Trace node) also shows one row per file its last evaluation used, as an absolute path. A node’s plain file is a File row, a labeled file is a File <label> row, and a directory set’s time table is a Time table row. When two rows would share a label the later ones get a suffix, (2), (3), so every row stays unique.
When it refreshes
The pane re-reads its figures when a pass completes, when a node is marked out of date or its cache is cleared, when a Plot’s drawing is committed to a viewport, and when the selection changes to or from exactly one node. Dirtying a node therefore updates Payload memory at once, without waiting for the next pass.
Values are plain selectable text, so a long file path can be selected and copied, and each value also shows its full text as a tooltip.