 PVA
Guide / Chapter 3
The Plotter
Each Plotter node, XYZ or RTP, owns a 3-D viewport. Viewports are derived from nodes: connect Plot and Camera nodes to a Plotter’s scene port to draw in its viewport, and edit the Plotter’s settings in the Parameters pane. One Plotter is the main one; the others open as extra viewports (Viewports).
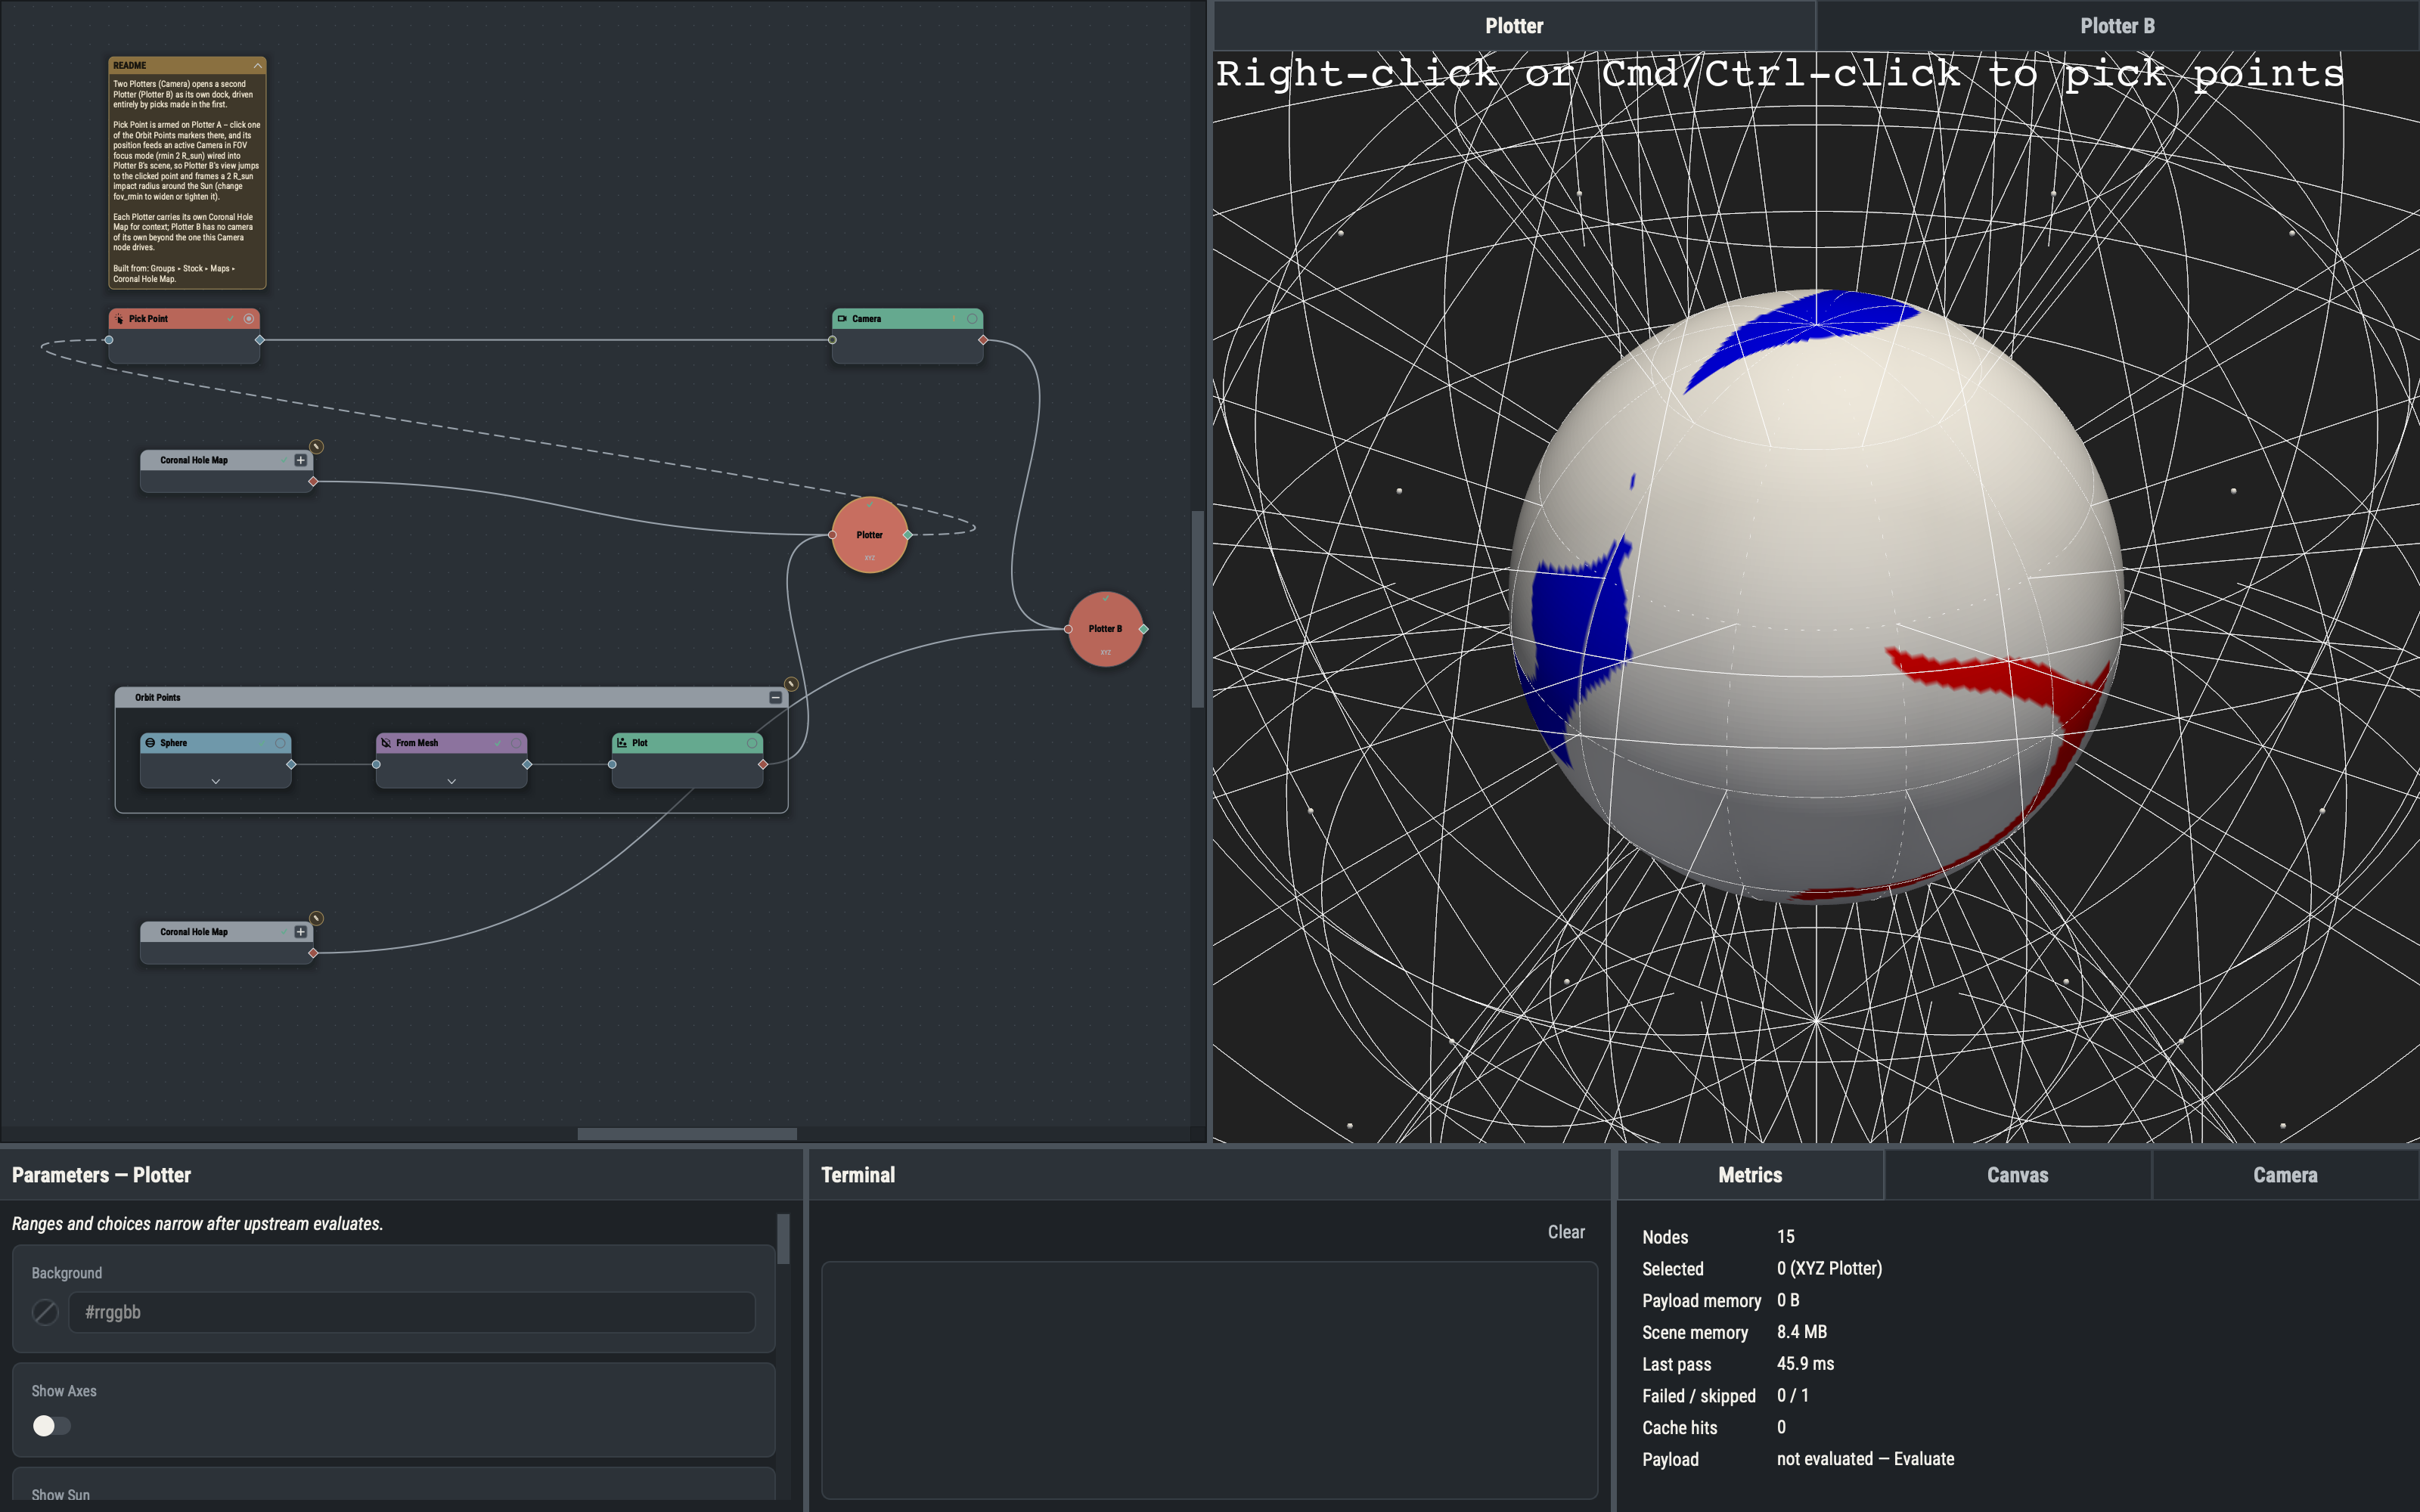
The Plotter node
A Plotter is drawn as a circle captioned XYZ or RTP, with two ports. The scene input accepts any number of render payloads (Plot and Camera nodes); each connected Plot adds one actor to this Plotter’s viewport, and a Plot connected to several Plotters is drawn in each. The events output carries interaction events to a holder (Interactivity); it connects only to a holder, and any other target is refused with the reason in the Terminal.
A Plotter sits outside the evaluation model: it never evaluates, its badge stays clean, and editing its settings never dirties the graph. The values apply to the live viewport directly. Plotter, Plot and Camera are all under Nodes ▸ Plotter. How a Plot becomes an actor, and how a stack is drawn, is covered in Plot Node.
The main Plotter
A new session starts with one XYZ Plotter as the main Plotter, which owns the permanent viewport. To change which Plotter is main, select one non-main Plotter and choose Set as Main Plotter from the Actions menu (Actions menu). It is one undo step, the Camera pane rebinds, the main frame follows the new Plotter’s type, and the previous main Plotter becomes an ordinary extra viewport. The main Plotter cannot be deleted; make another Plotter main first.
XYZ Plotter and RTP Plotter
| Type | Frame | Behavior |
|---|---|---|
| XYZ Plotter | Cartesian | The usual choice for solar and heliospheric scenes. Positions given as (r, θ, φ) are converted to Cartesian at the viewport. Solar geometry is available: the Sun glyph, line-of-sight and field-of-view views, and solar-north up. |
| RTP Plotter | Spherical (raw) | Draws (r, θ, φ) values directly as raw x, y, z: mesh points, camera positions and event payloads are all raw. Suited to data in its own coordinate space. |
An RTP Plotter has no solar-frame geometry, so the Camera pane disables the controls that need it (see Camera Pane) and it has no Show Sun setting or Grid lines.
Plotter settings
| Setting | Default | Meaning |
|---|---|---|
| Background | blank | Viewport background. Blank uses the theme from Settings ▸ Plotter; a color set here overrides the theme and survives theme edits. |
| Show Axes | off | The orientation axes widget. |
| Show Sun | off | The Sun glyph (XYZ only). |
| Grid lines | off | A structured spherical grid of lines (XYZ only). Turning it on shows the r, θ and φ ranges, each with a line count and a sample resolution, plus the grid color and line width. |
| Depth peeling | off | Renders overlapping translucent surfaces in the correct order; unsupported hardware ignores it. |
| Peels | 4 | Maximum peeling layers, shown while depth peeling is on. |
| Occlusion ratio | 0 | Depth-peeling occlusion ratio, 0 to 1. |
The general appearance of every viewport is set on the Plotter page of Settings. Two of the rows above override it per Plotter: a Plotter’s own Background wins over the theme’s background, and its Show Axes switch wins over the theme’s Show axes entry, which is only the default for new plotters.
Grid lines. The grid rows start at r from 1 to 5 R_sun with 5 lines and a resolution of 2, θ from 0° to 180° with 7 lines and a resolution of 60, and φ from 0° to 360° with 13 lines and a resolution of 120; the θ and φ ranges can be entered in degrees or radians. The line width starts at 1. A blank grid color, or a line width of 0, keeps the default of the underlying viewport library.
Depth peeling. The switch is applied on a best-effort basis. On a graphics card that cannot do depth peeling it may silently do nothing: PVA neither reports an error nor changes the drawing, so translucent surfaces then stay unordered.