 PVA
Guide / Chapter 12
Terminal Pane
The Terminal is the application log: a read-only, severity-colored line per record, with the time and the source (a node’s title and id, or an area such as graph, settings or launch). Errors are reported here instead of in blocking dialogs, so a failed evaluation, a bad setting or a failed export never interrupts your work. Errors are failures such as a node that failed or a setting that was rejected, warnings are things such as a slow computation or dropped data, and info is session, save and capture messages.
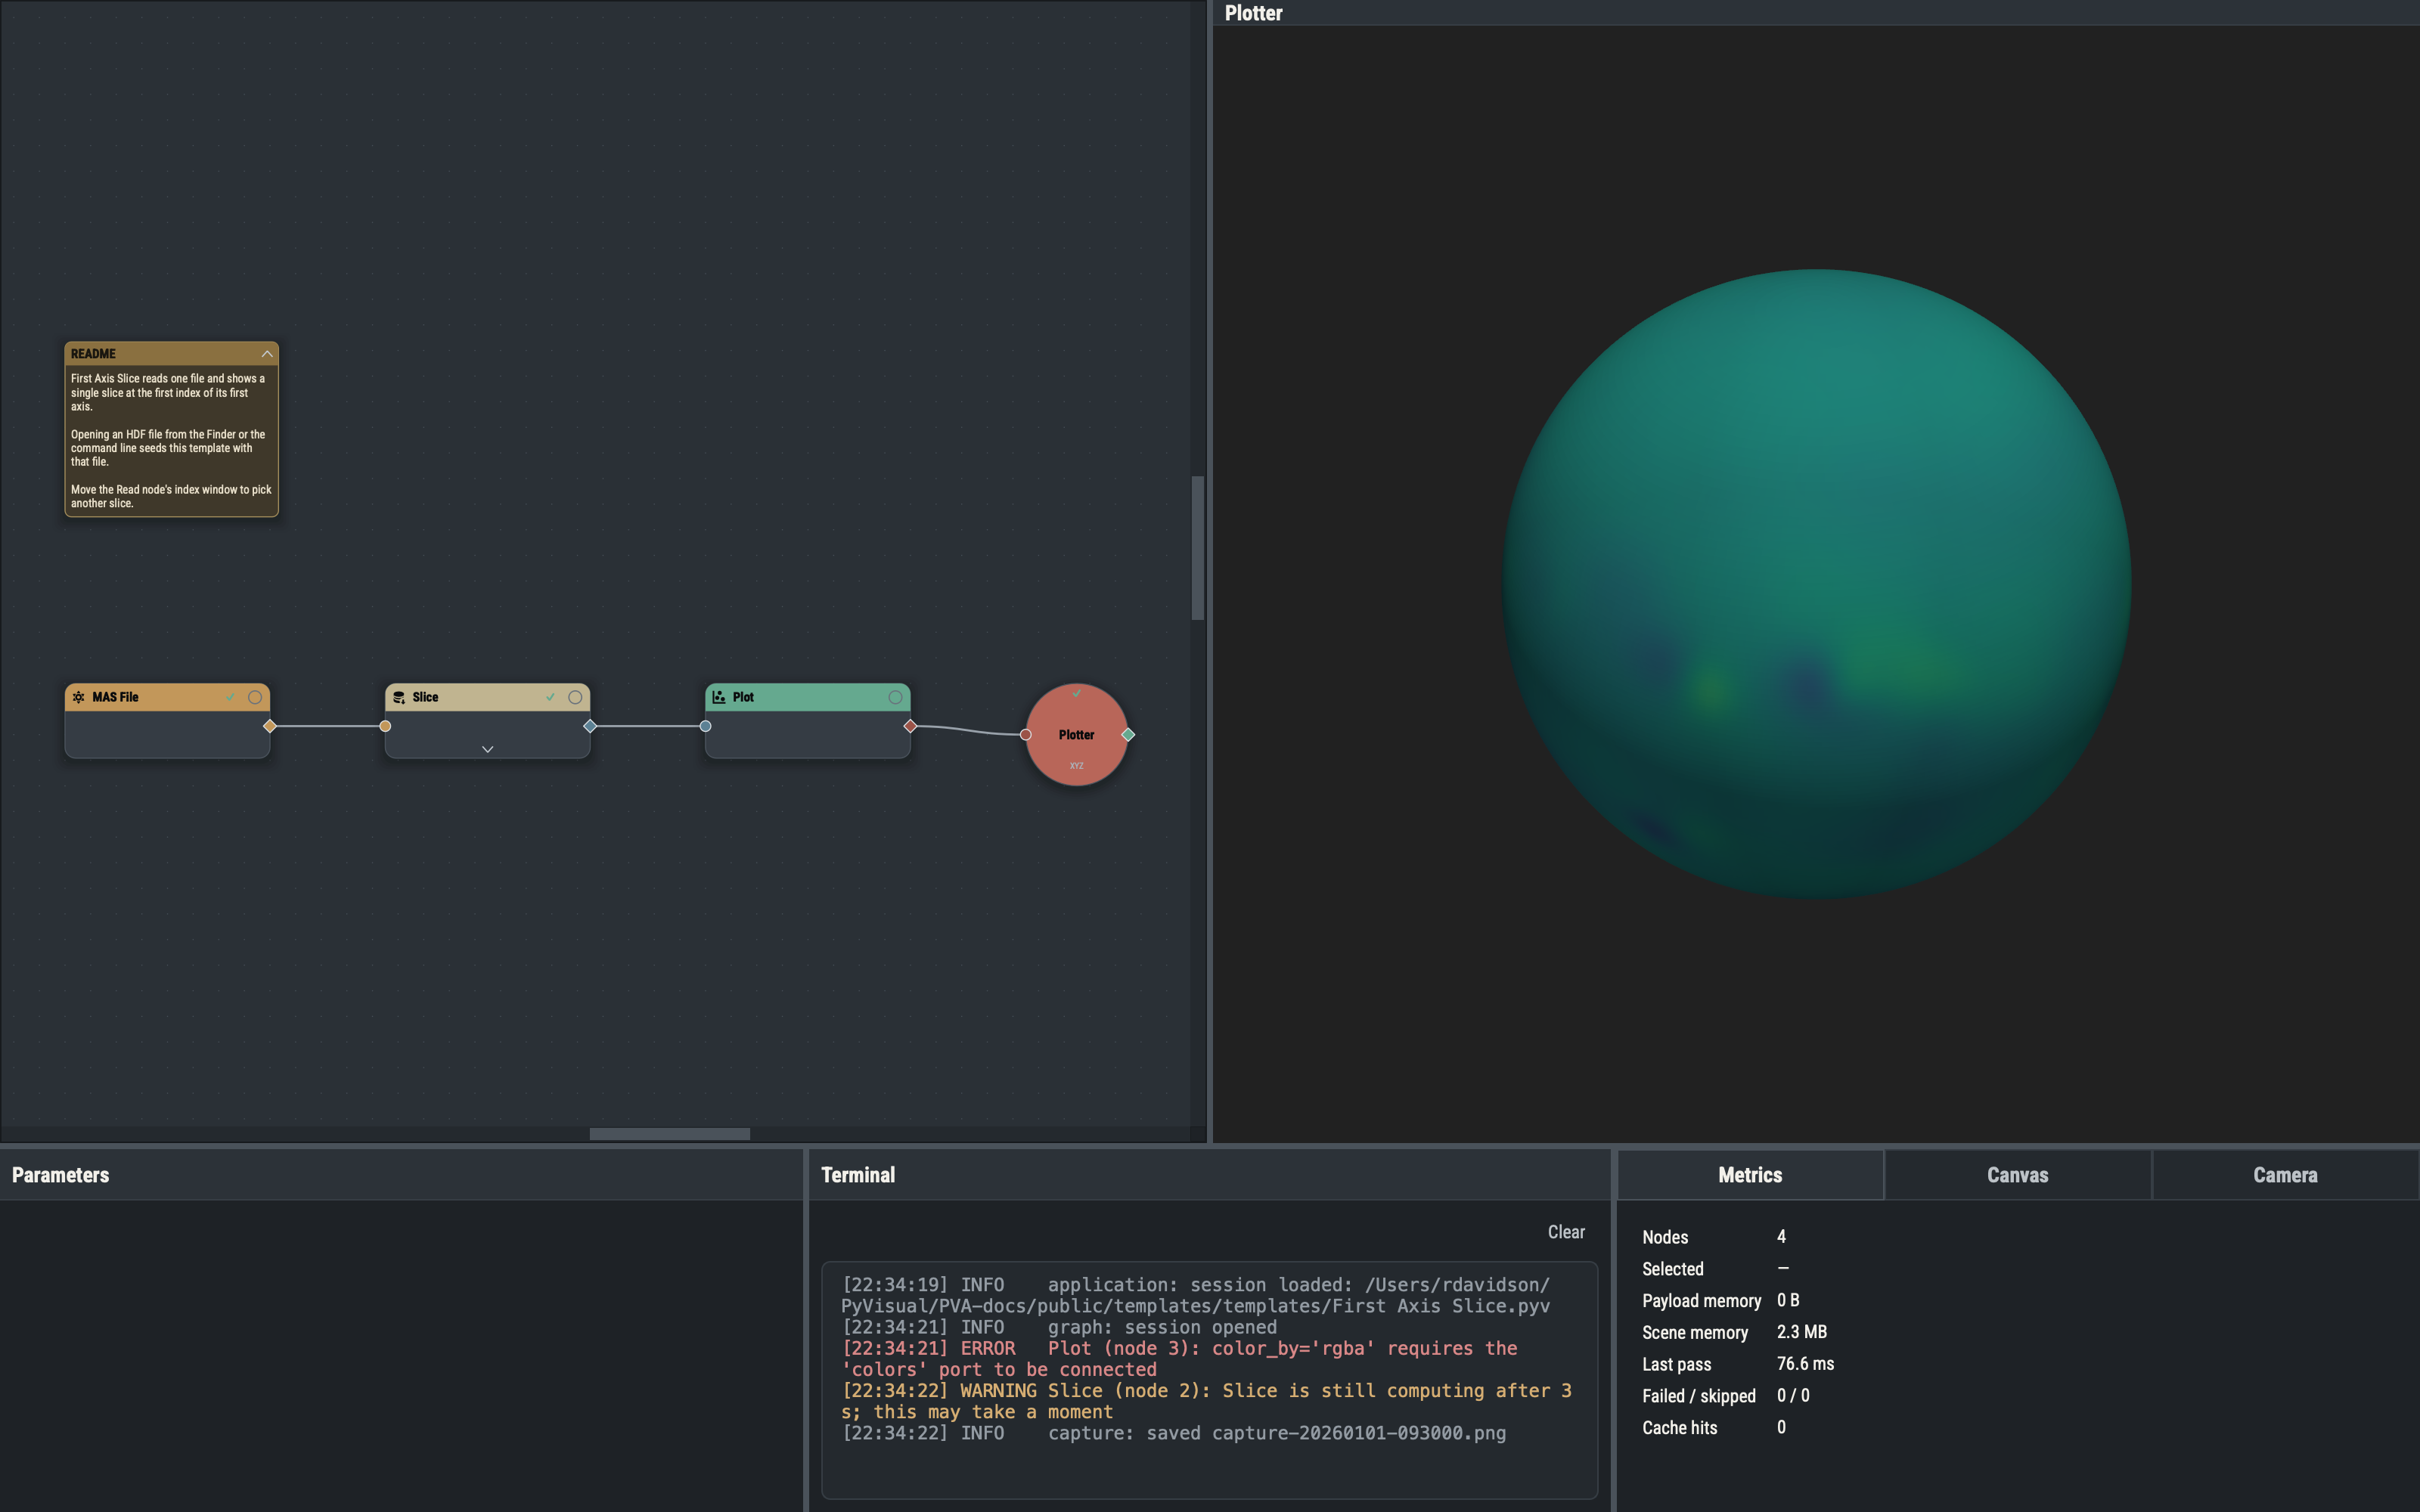
Line format
Each record is one line:
[HH:MM:SS] LEVEL source: messageThe time is local. LEVEL is ERROR, WARNING or INFO, padded so the sources line up. The source is the originating node’s title followed by its id, as in Slice (node 12), or the name of an area for a message that no node produced. A failed evaluation logs the node’s id, title and message, and the node also shows an error badge on the canvas. An export logs a line that begins export: with the file it wrote.
Severities and colors
| Severity | Used for | Color |
|---|---|---|
| Error | A node that failed, a rejected setting, a failed export or capture. | Muted red |
| Warning | A slow computation, dropped data. | Amber |
| Info | Session, save, capture and export messages. | Gray |
The three colors are the severity_colors table of style.toml.
What the pane keeps
The log is a flat, append-only list with the newest record at the bottom, and the pane scrolls to follow it. It keeps the most recent 5000 records and silently drops the oldest beyond that. It is not saved with a session, and starts empty at each launch apart from startup problems. Nothing in it opens a popup.
The text is read-only but selectable: select lines with the mouse and copy them with the usual copy chord. Clear, the button at the top right of the pane, empties the log.
Unread badges
While the Terminal is not the pane you are looking at, new records are counted per severity. The counts show as pills on the pane’s header and in its tab title, for example Terminal ✗2 ⚠1 •3: ✗ counts errors, ⚠ warnings and • info lines, in that order, and a zero count is left out. The counts clear when focus enters the pane, when its tab is activated, when you choose View ▸ Terminal, or on Clear. A record that arrives while focus is already inside the Terminal is read at once and never counted. The counts belong to the window and are not saved.
Slow-computation warning
When one node computes longer than a threshold, the Terminal logs one warning naming it. The threshold is Settings ▸ Defaults ▸ Evaluation (3 seconds by default, 0 disables it), measured from when that node’s computation begins (Slow-computation warning). The line reads
[12:16:38] WARNING Slice (node 2): Slice is still computing after 3 s; this may take a momentand, for a trace node, the message ends with the tracer timeout from Settings ▸ Defaults ▸ Tracer, as in (the tracer times out after 60 s). Only one node computes at a time, so only one warning is ever pending, and a computation produces at most one line.